Community losses and gains
The years 2020 and 2021 blurred together as our communities collectively navigated how to work, gather and connect in ways that mitigated risk. My previous annual report was published in July of 2020 when time seemed to warp. So much was unknown. The nation and my city were alight with protest, an emotional firestorm and, later in the summer, an actual blazing Oregon wildfire.
These were dramatic and tumultuous years, with the economy and our collective optimism waning with every COVID spike. With so much despair about national inaction, I looked locally for hope and inspiration. I looked to the multi-faith leaders coming together to organize for gun reform, to the growth of the Portland Street Response as an alternative to police, to the resurgence of community events relaunching this summer after a two year hiatus. Events that feel more purpose-driven, diverse with a new focus on equity and access. My community is starting to come back, and the joyful gatherings feel like collective healing.
Against this backdrop, I turned 40. I am welcoming all the hallmarks of middle-agedness: feeling out of touch with Gen Z lingo, fighting to stay on top of technology changes, and being reluctant to embrace fashion trends or attend events that start past 8pm. But, I feel more confident in my work than ever. Every year brings new clients, new design challenges, and a growing portfolio that I am proud of. I understand the value my experience brings to my work, and I don’t feel stuck or bored. So onward I go, embracing my middle-aged years, confident in the road ahead.
Here is a year-in-review of my business financials for 2020 and 2021
Incoming
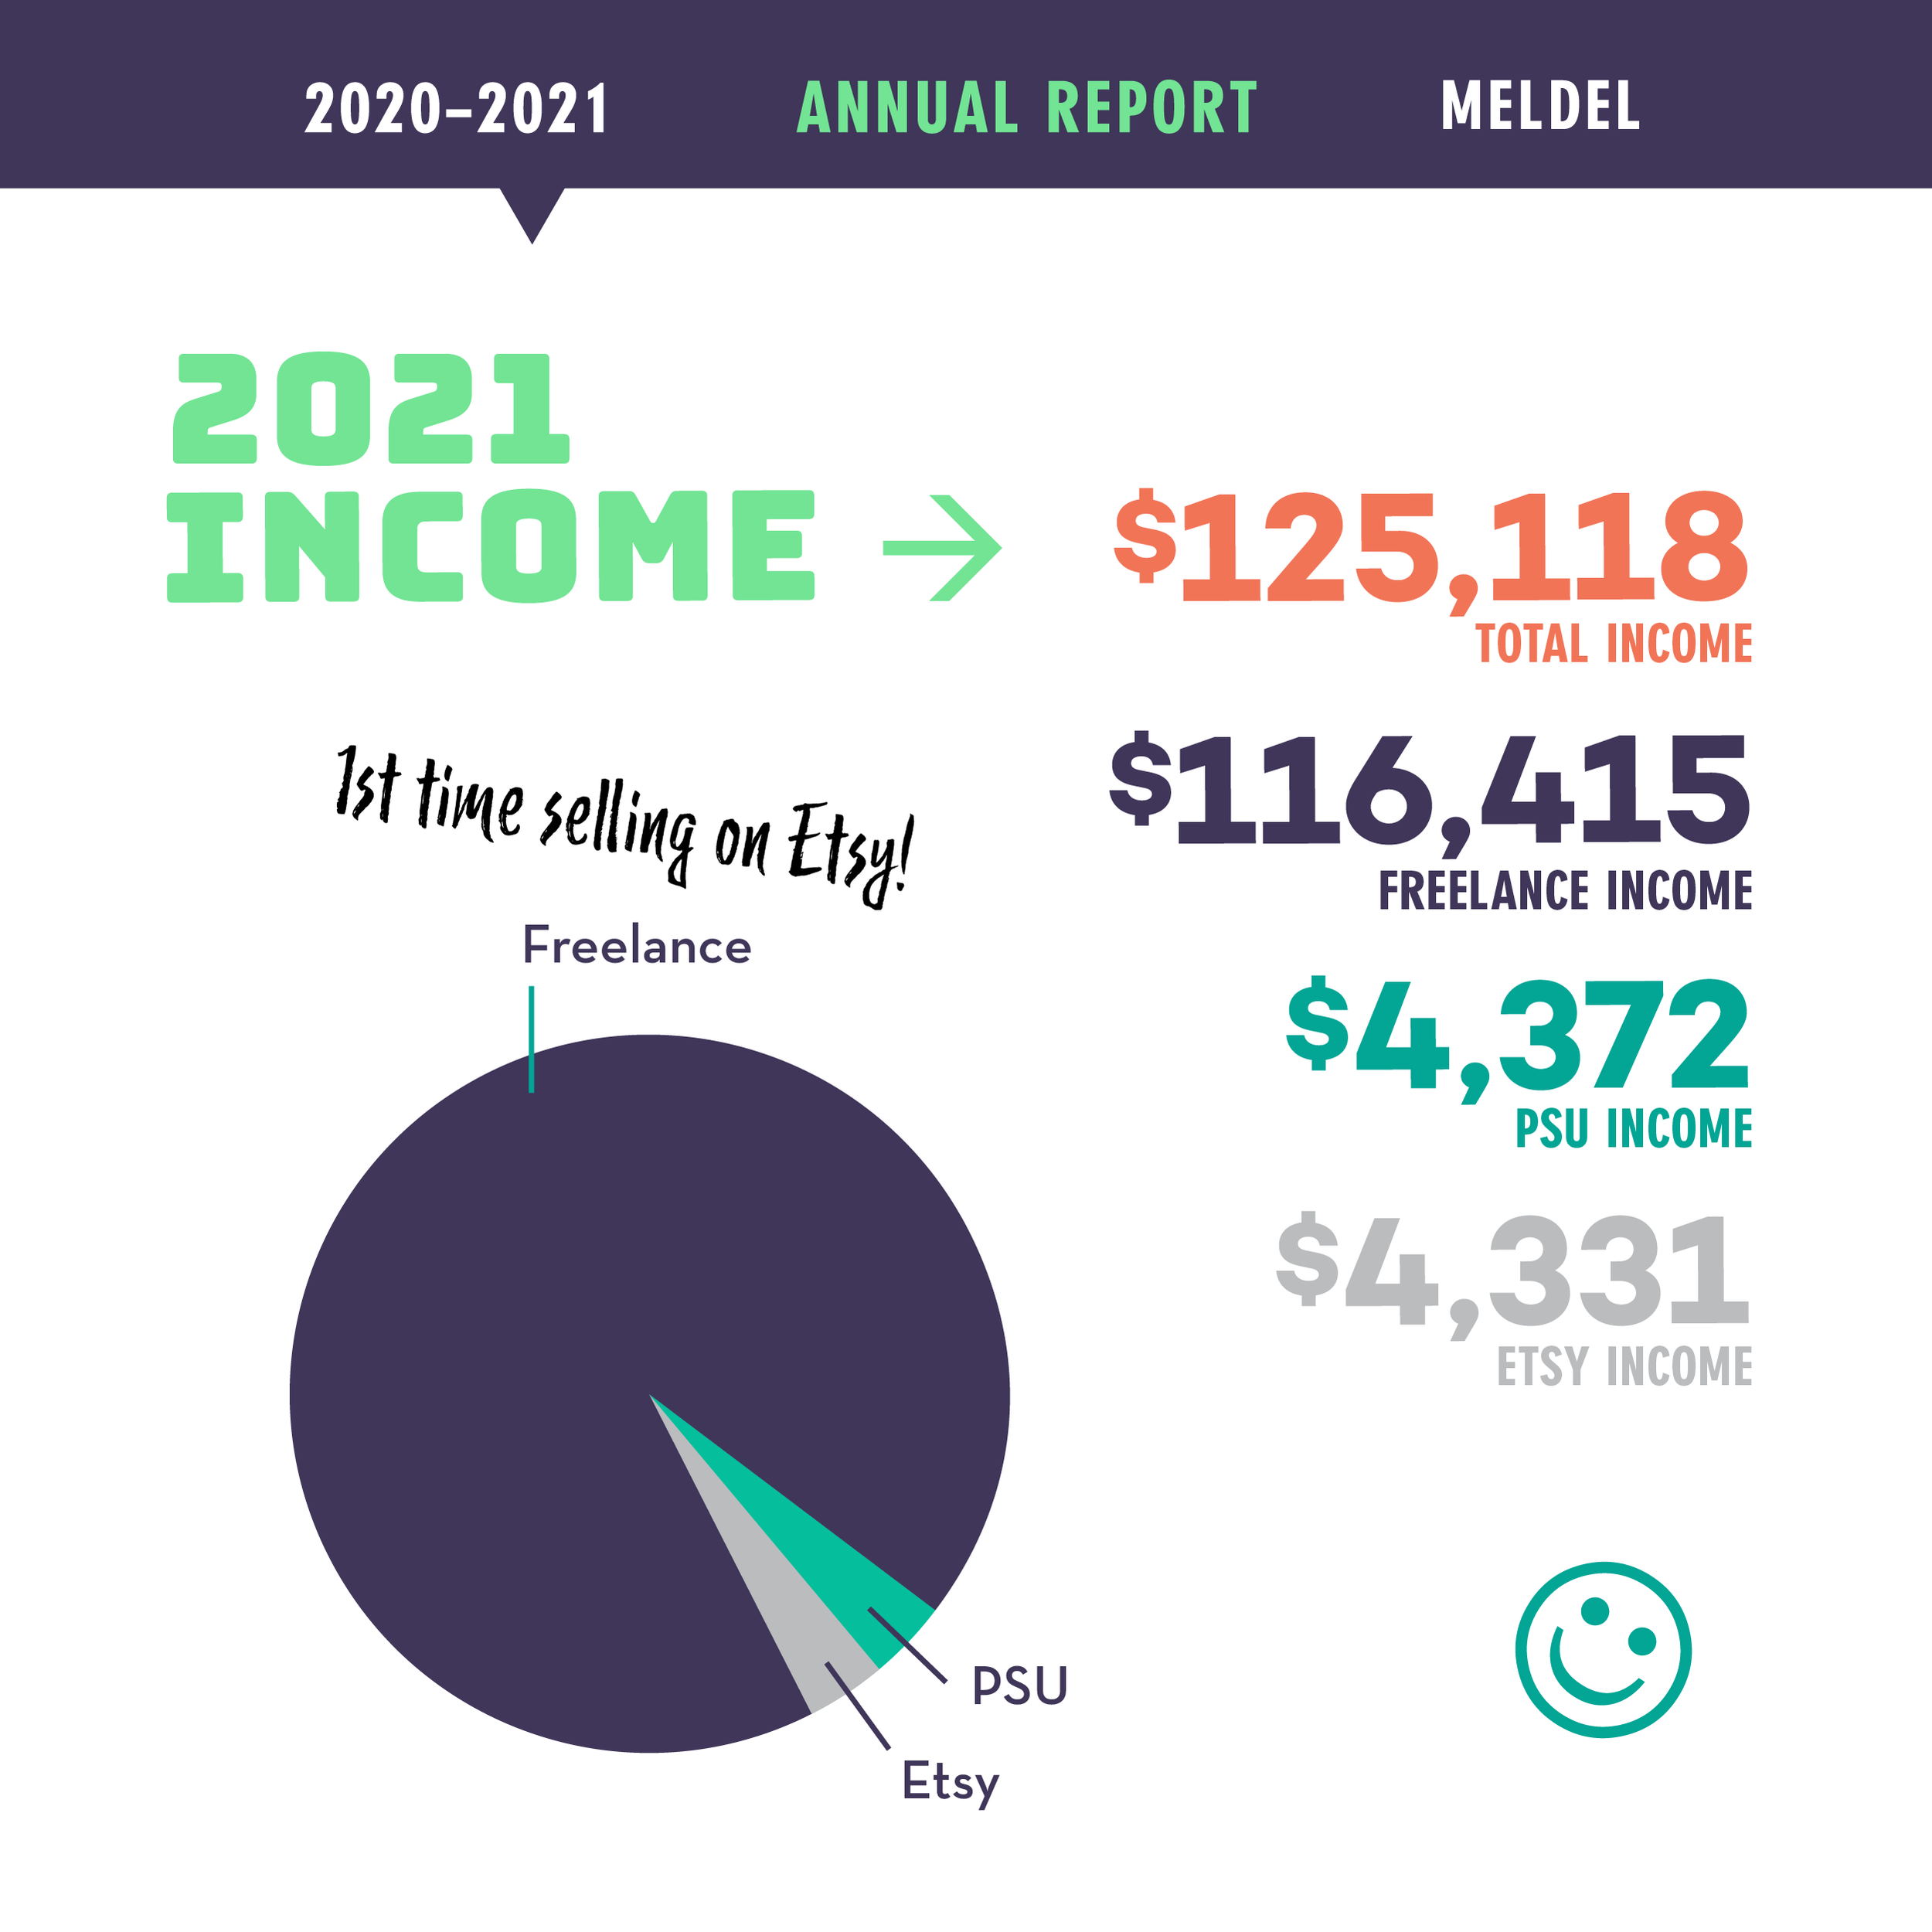
I was lucky to have been able to weather the COVID years well largely because of COVID. In October of 2020 I was approached by Brink Communications to join their creative team on a freelance basis to work as a designer on the newly developed brand, Safe + Strong. The Safe + Strong campaign was initiated by the Oregon Health Authority initially to promote COVID “harm reduction” messaging. Basically they wanted to encourage mask adoption, to dissuade people from gathering in groups, and take other basic COVID precautions. The vision was to have these messages delivered warmly, through the lens of love: for your community, your family, yourself. Kicking off this work in 2020, I had no idea it would come to dominate my design docket for nearly two years, transitioning to vaccination messaging. The campaign assets were wide-ranging from a website refresh, design of over a hundred billboards, digital ads, direct mail pieces and more. Art directing photoshoots during the pandemic presented new challenges to surmount, like how to show love, affection and care between masked people 6 feet apart! Doing this important work during a trying time has been very rewarding, and I have been excited to see the results on the streets of Portland in the form of billboards and transit ads.
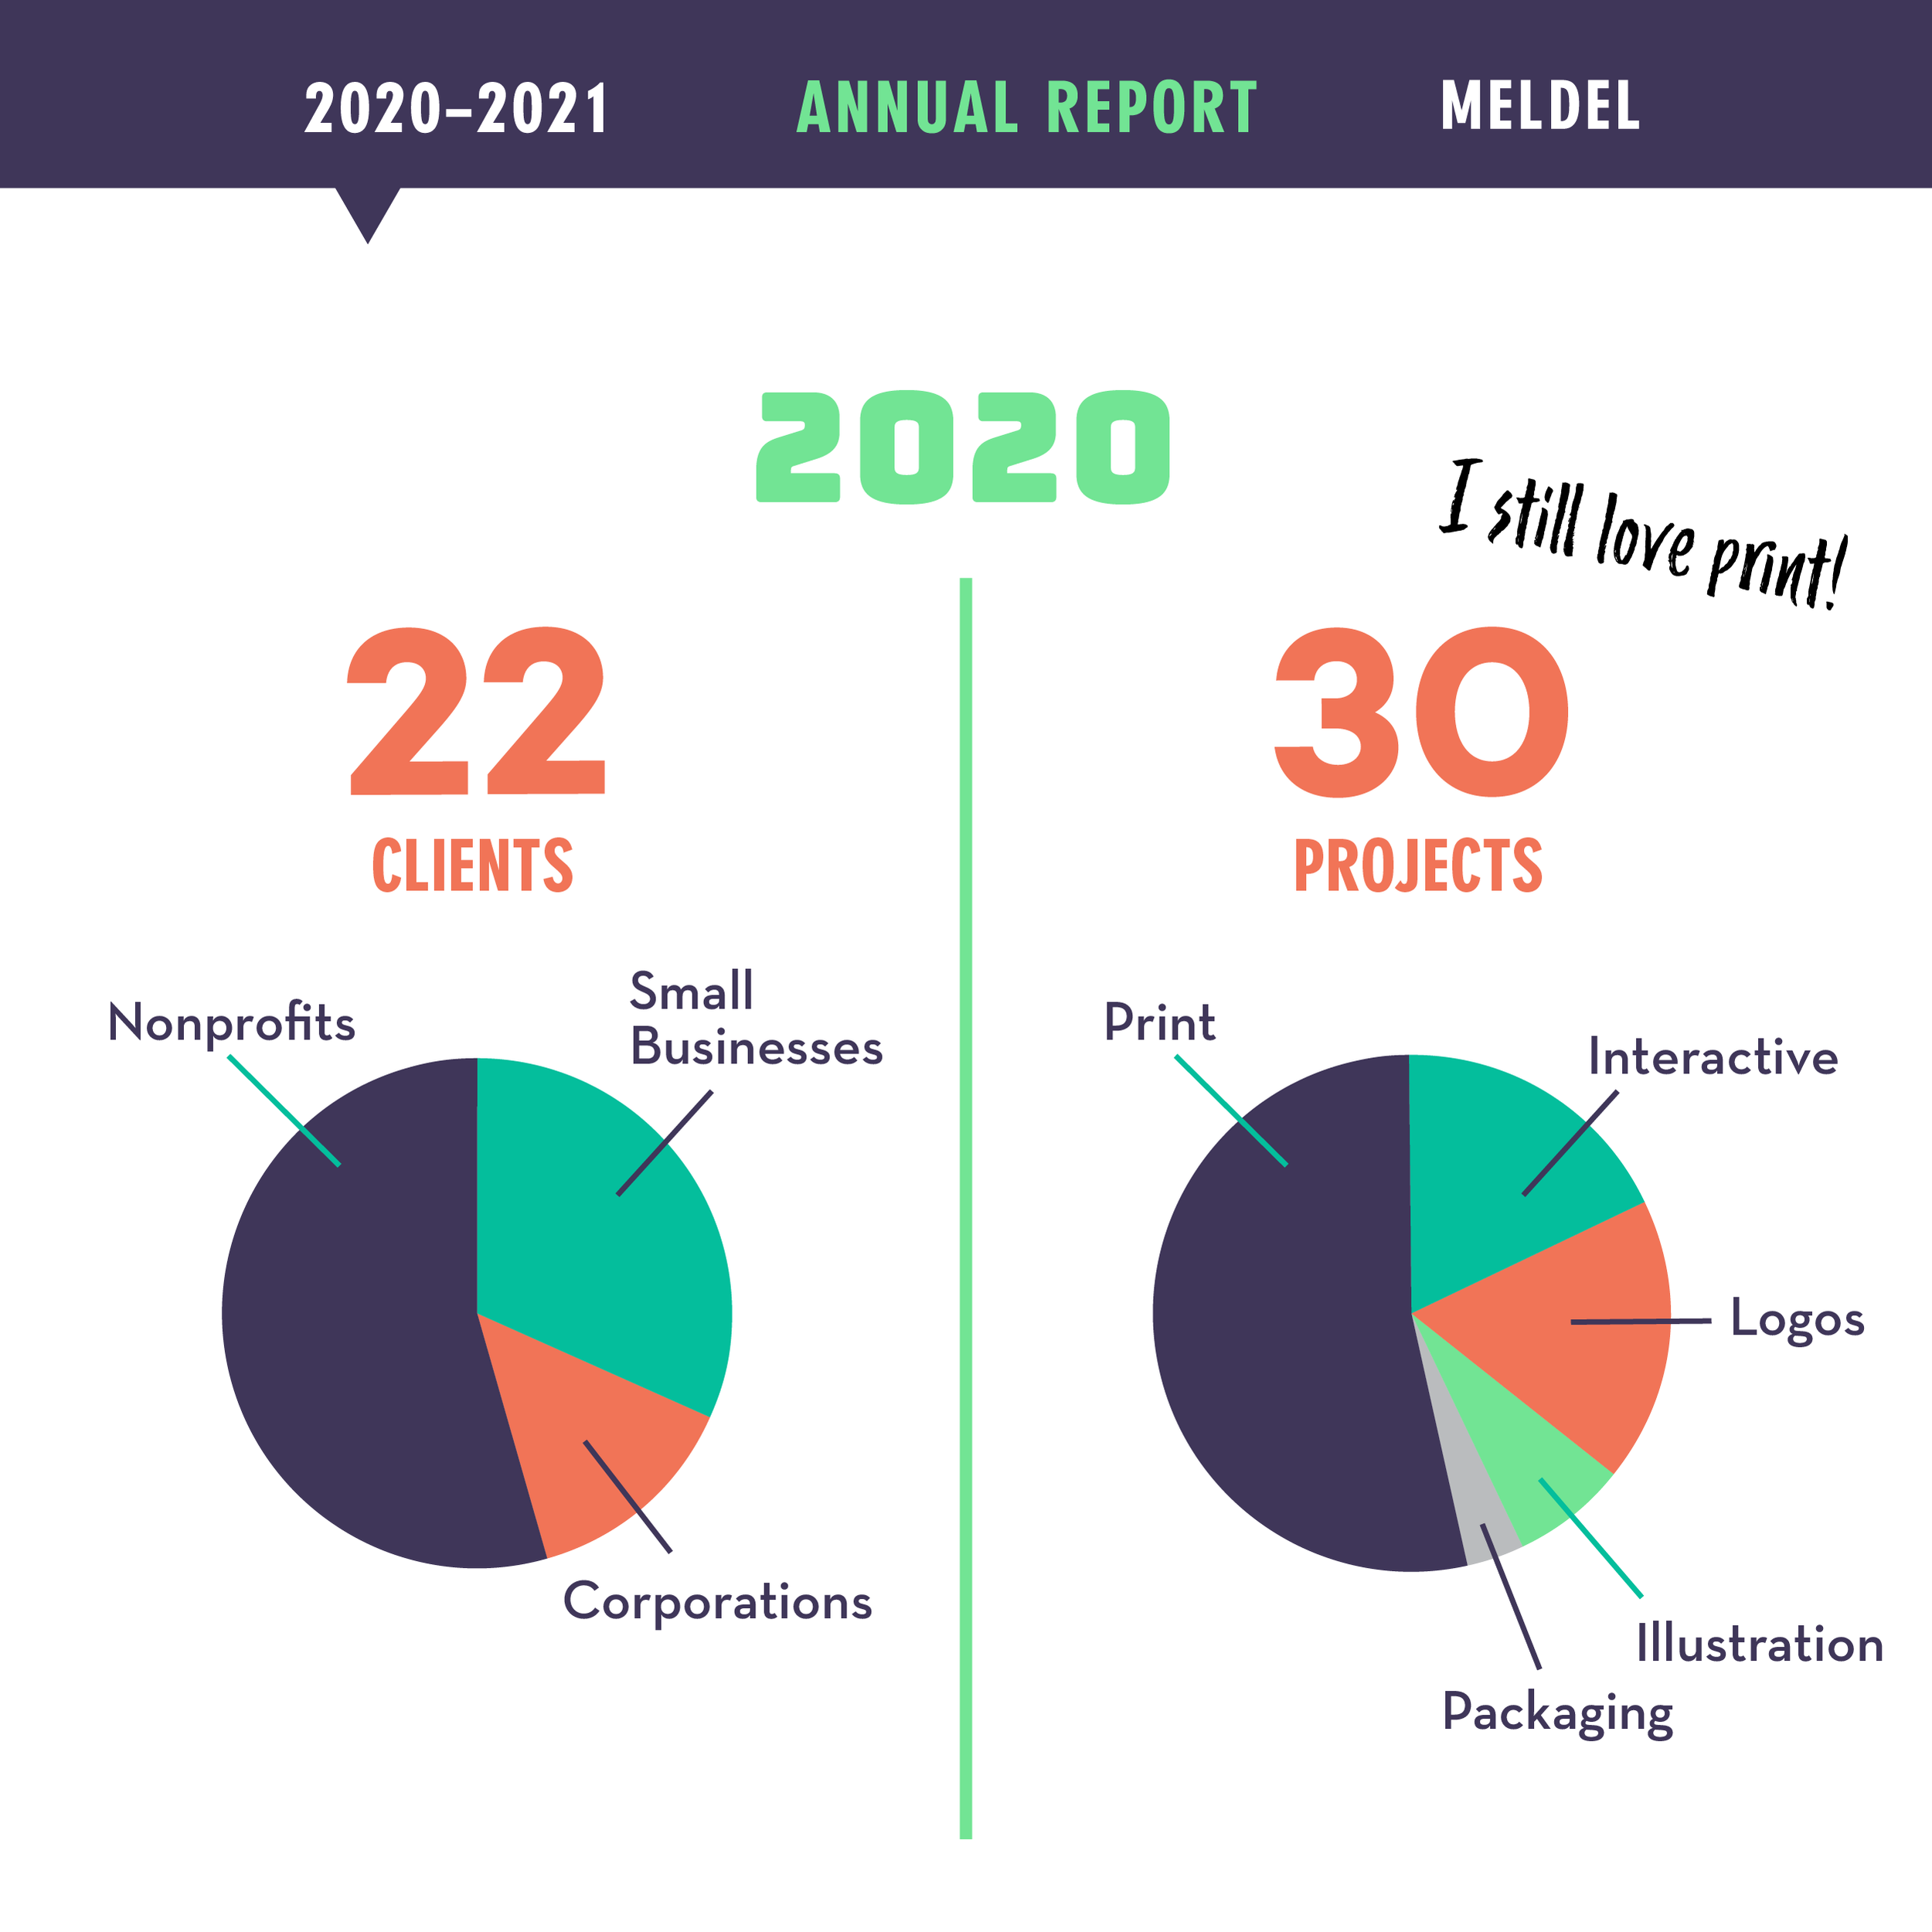
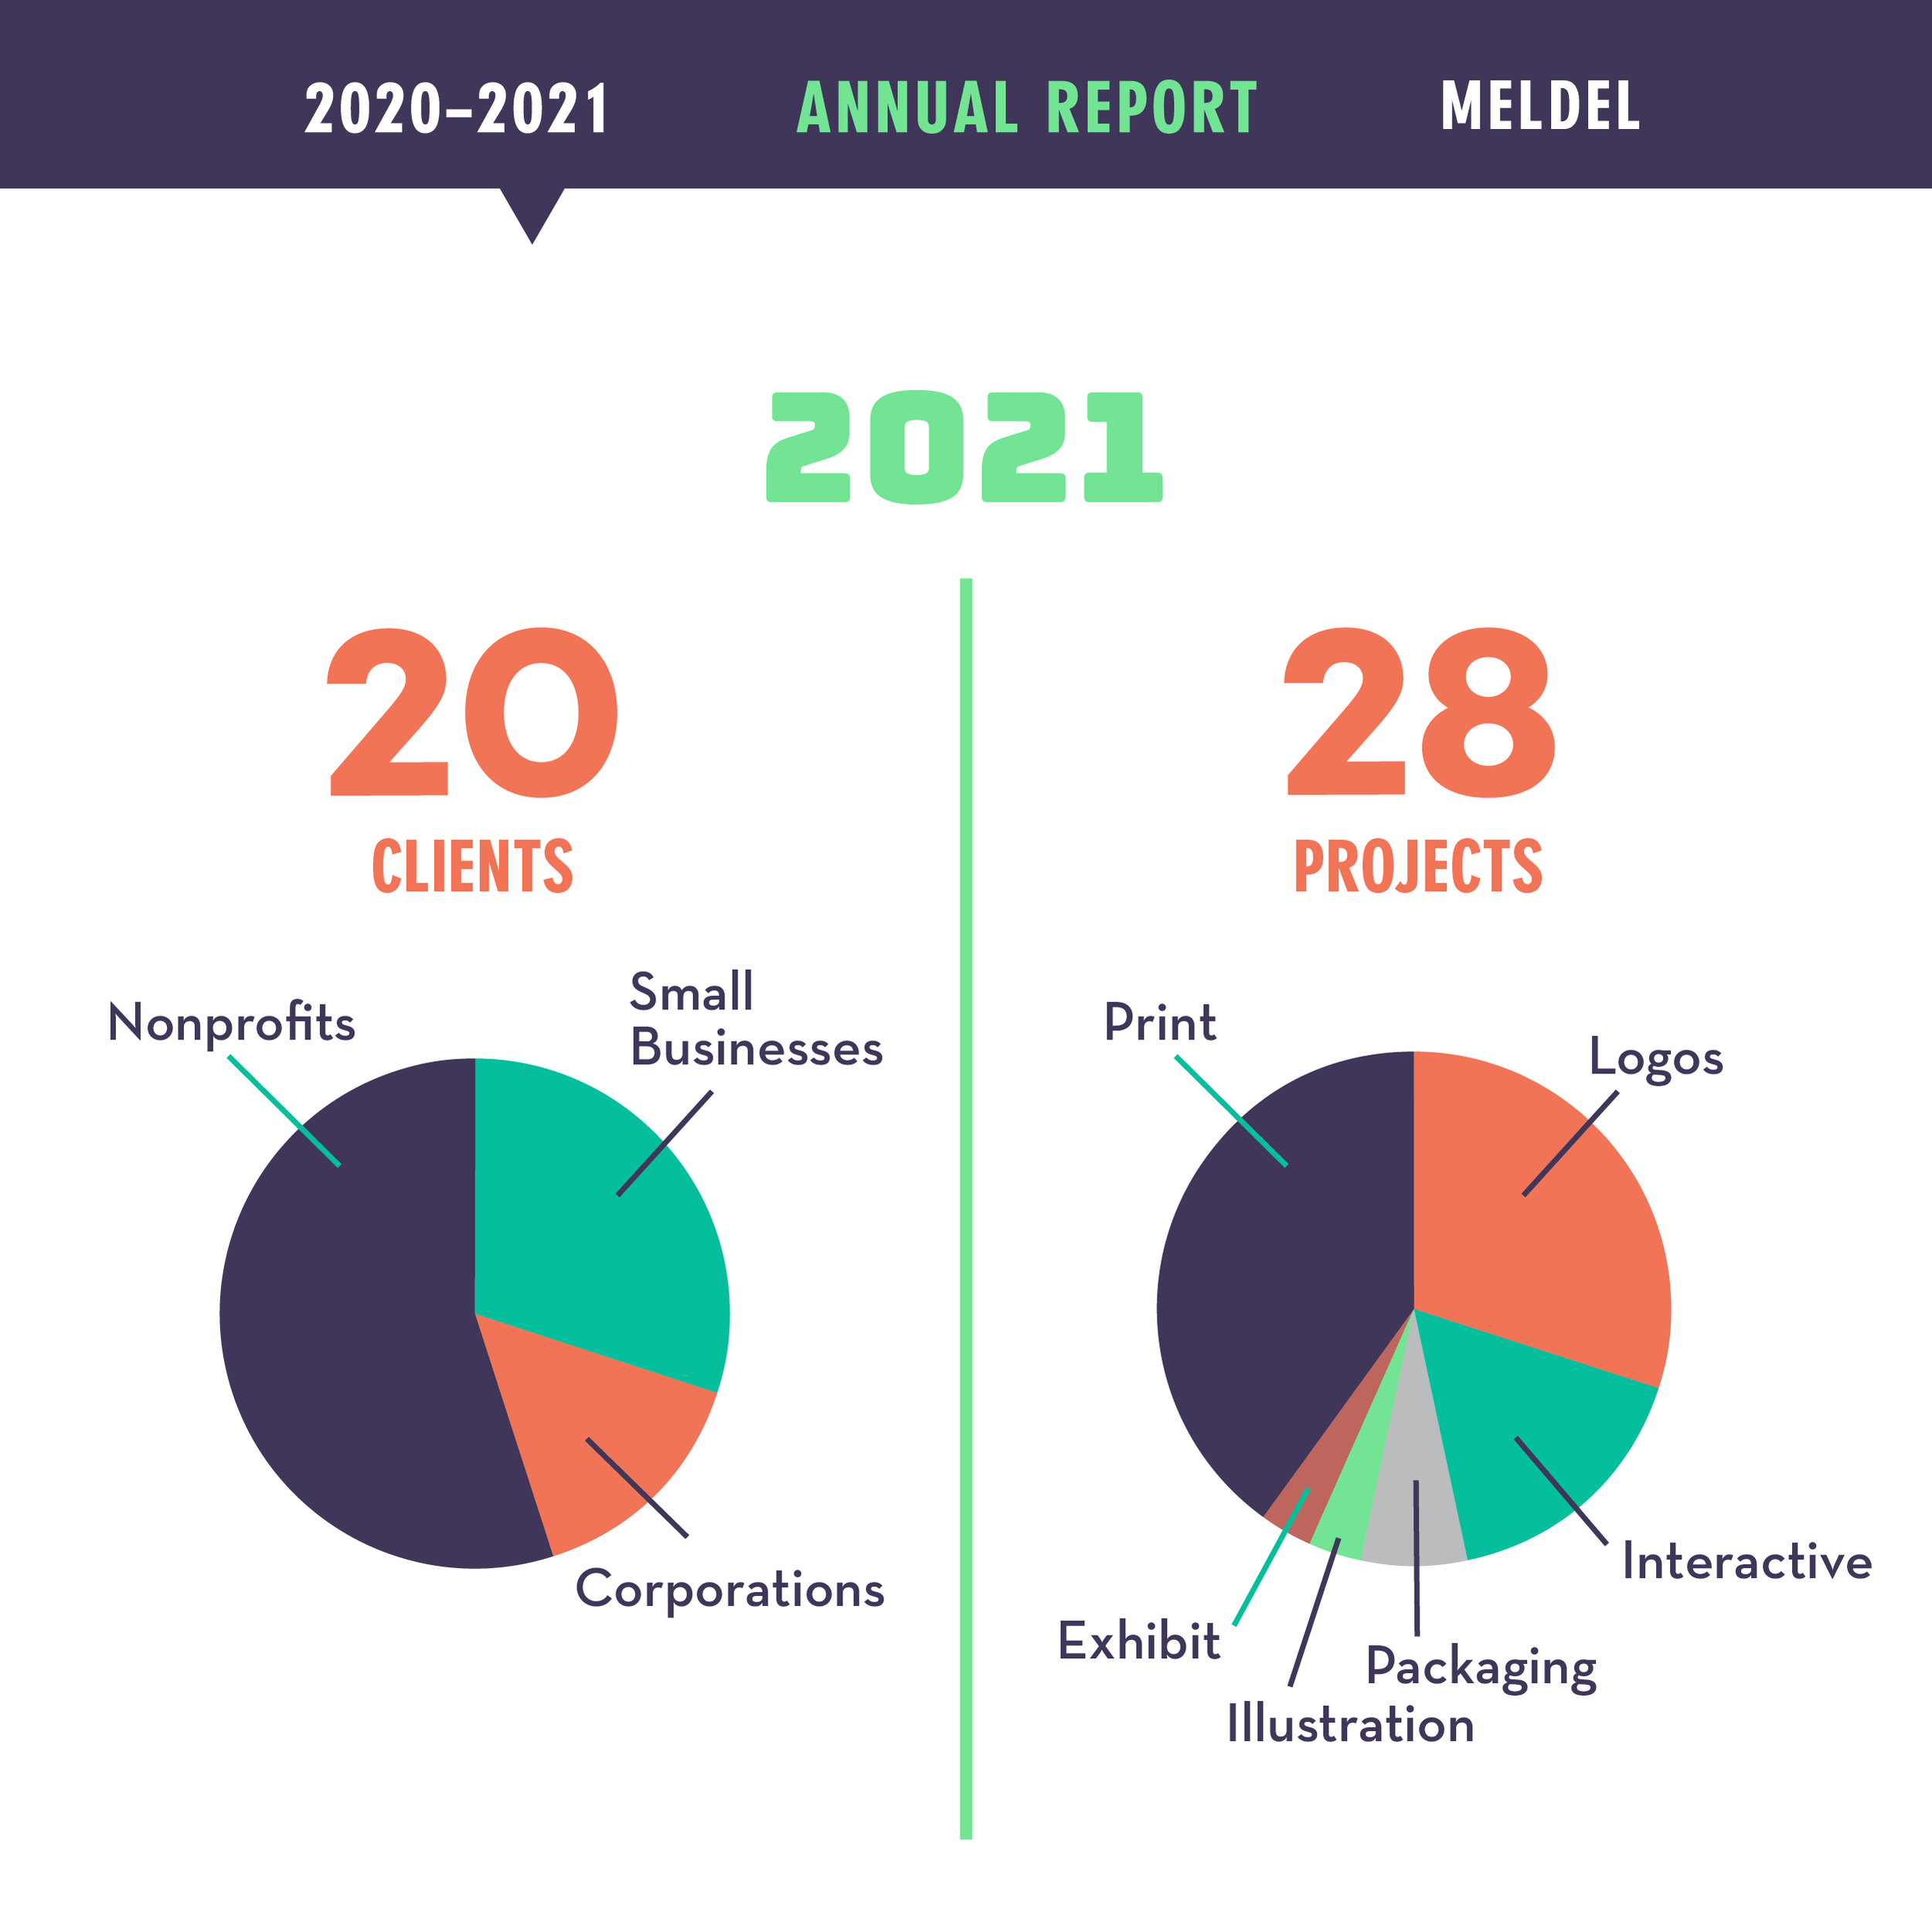
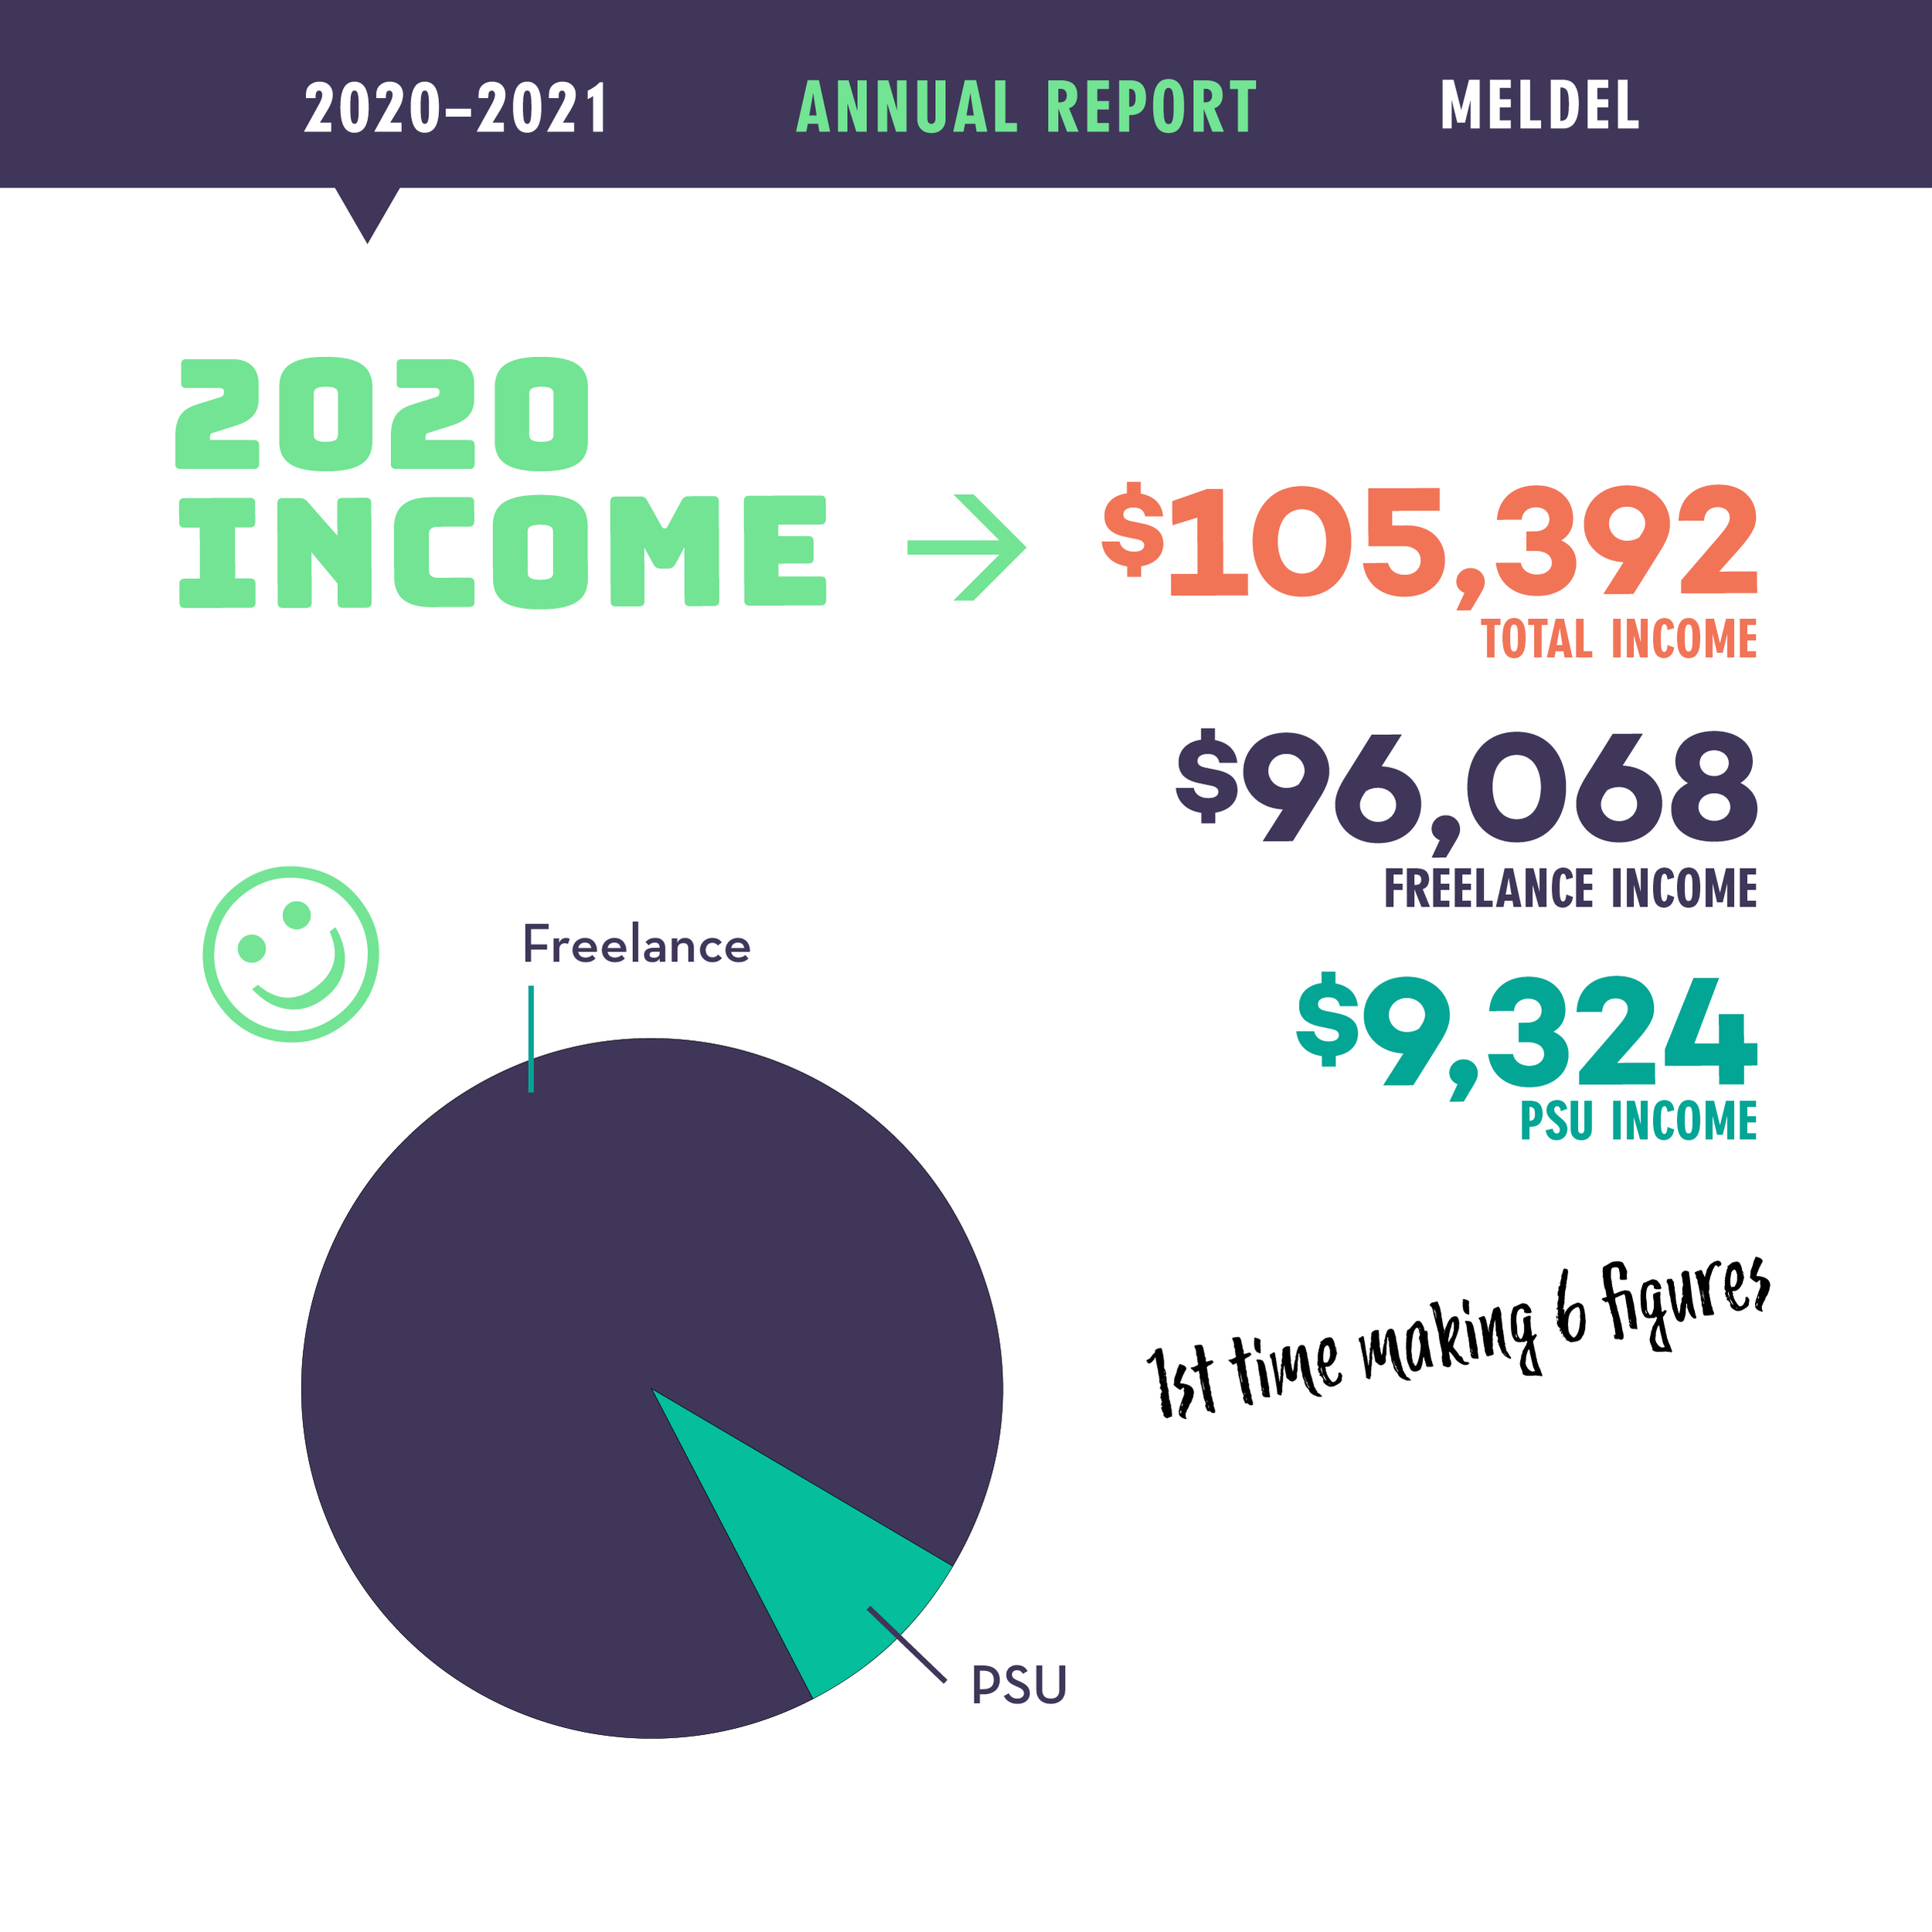
Buoyed by this regular income boost, my 2020 total income came in at about $105,000. This includes income from my business as well as teaching at PSU (W2 income), which I do on the side as a Senior Adjunct Instructor. In 2020, I taught a class that I designed and developed called, Portland Design History, which engaged students in researching, interviewing, archiving and writing content about Portland’s great designers and brands from the past. The foundation for this class was the research I have been conducting independently for years at PortlandDesignHistory.com, and the student’s participation was a big boost! Fortunately, the class wrapped in March of 2020, just as COVID restrictions were coming into play. We were able to successfully finish the term in person. However, I was signed up to teach my regular class, The History of Modern Design in the Spring Term of 2020, and that class went all online because of COVID, leaving us teachers one week to overhaul curriculum and figure out new technologies. I had also planned an April 2020 student trip to San Francisco, which had to be cancelled. Luckily, PSU gave us lots of support and the adjunct union contributed money to teachers who had classes cancelled due to COVID, which is included in the income total. My household also received a stimulus as a part of the American Rescue Plan. Those distributions were based off of 2019 household income, which was low for me. My husband works in education, so our total income for 2019 qualified us. That money is not reflected here, because it was not business income.
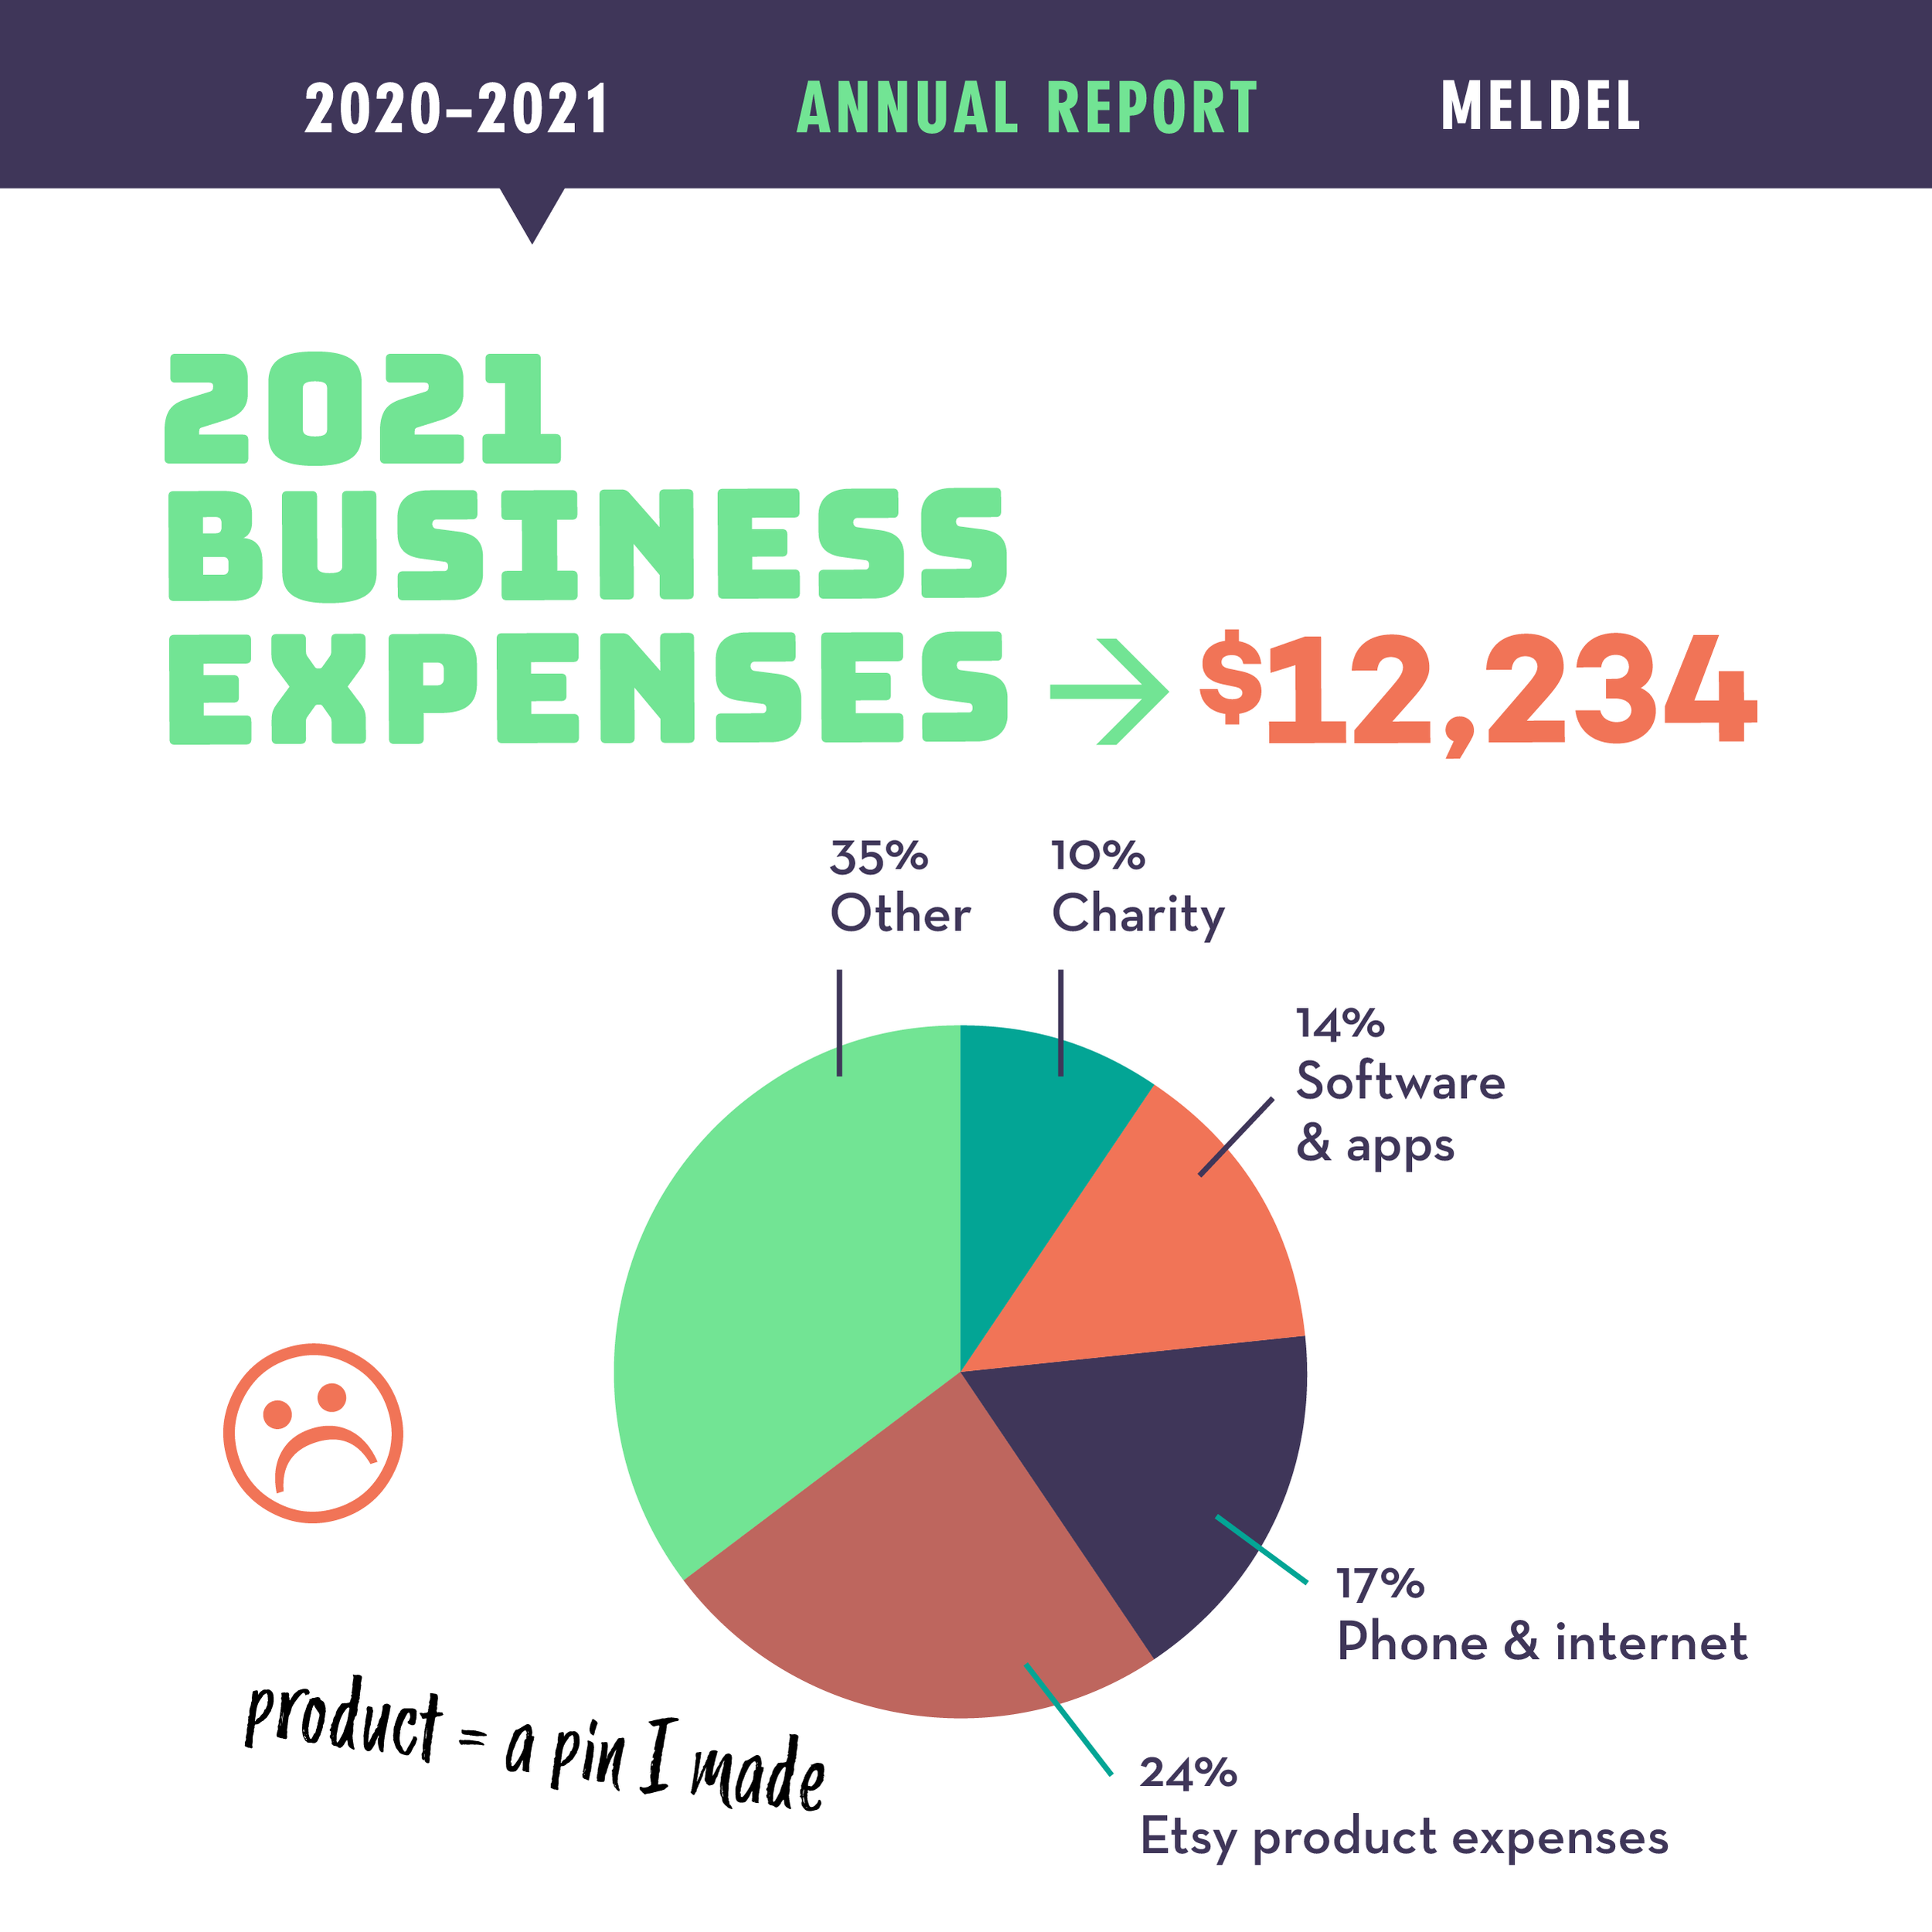
Finally, I developed a new stream of income as I designed, produced and sold enamel pins that advertised and promoted the wearer’s vaccination status. As the COVID vaccine was nearing approval, I foresaw the need to communicate your vaccine status to comfort folks you were engaging with, to invite questions, and to promote vaccinations in general. I modeled my design after “V” for Victory buttons post-WWII, and posted the pins for sale on Etsy. Orders came rolling in from all over the US, and it was rewarding to read review from nurses and others who were proud to wear the pin. Across 2021, I earned about $4,000 in pin sales, but this revenue stream had a lot of expenses like: production of the pins, purchase of mailing envelopes, postage, a postage meter, a label printer and paper. Then there were Etsy seller’s fees, and paid promotions on Instagram and Etsy. And of course, daily management to make sure orders were processed on time. This was a great learning experience. I did make some profit, and importantly I was able to donate $2 from every sale to p:ear, my nonprofit client who creatively mentors homeless youth. Overall, I found that the expenses, effort and upkeep of selling the pins did not make it financially worthwhile to continue. I took down the Etsy shop once sales slowed after the market was flooded with similar, cheaper products. Still, it was a fun endeavor, and I gained a new skill and appreciation for all you makers!
Overall, my total income increased by $49,204 in 2020 from 2019, and $19,726 from 2020 to 2021. This huge jump has more to do with 2019 being an extra bad year, as opposed to 2020 and 2021 being extra good. My income previous to 2019 was averaging between $85,000 and $97,000. Finally getting over the hump and into the six-figure range was a huge step for me, but there is no guarantee that trend will continue.
Outgoing
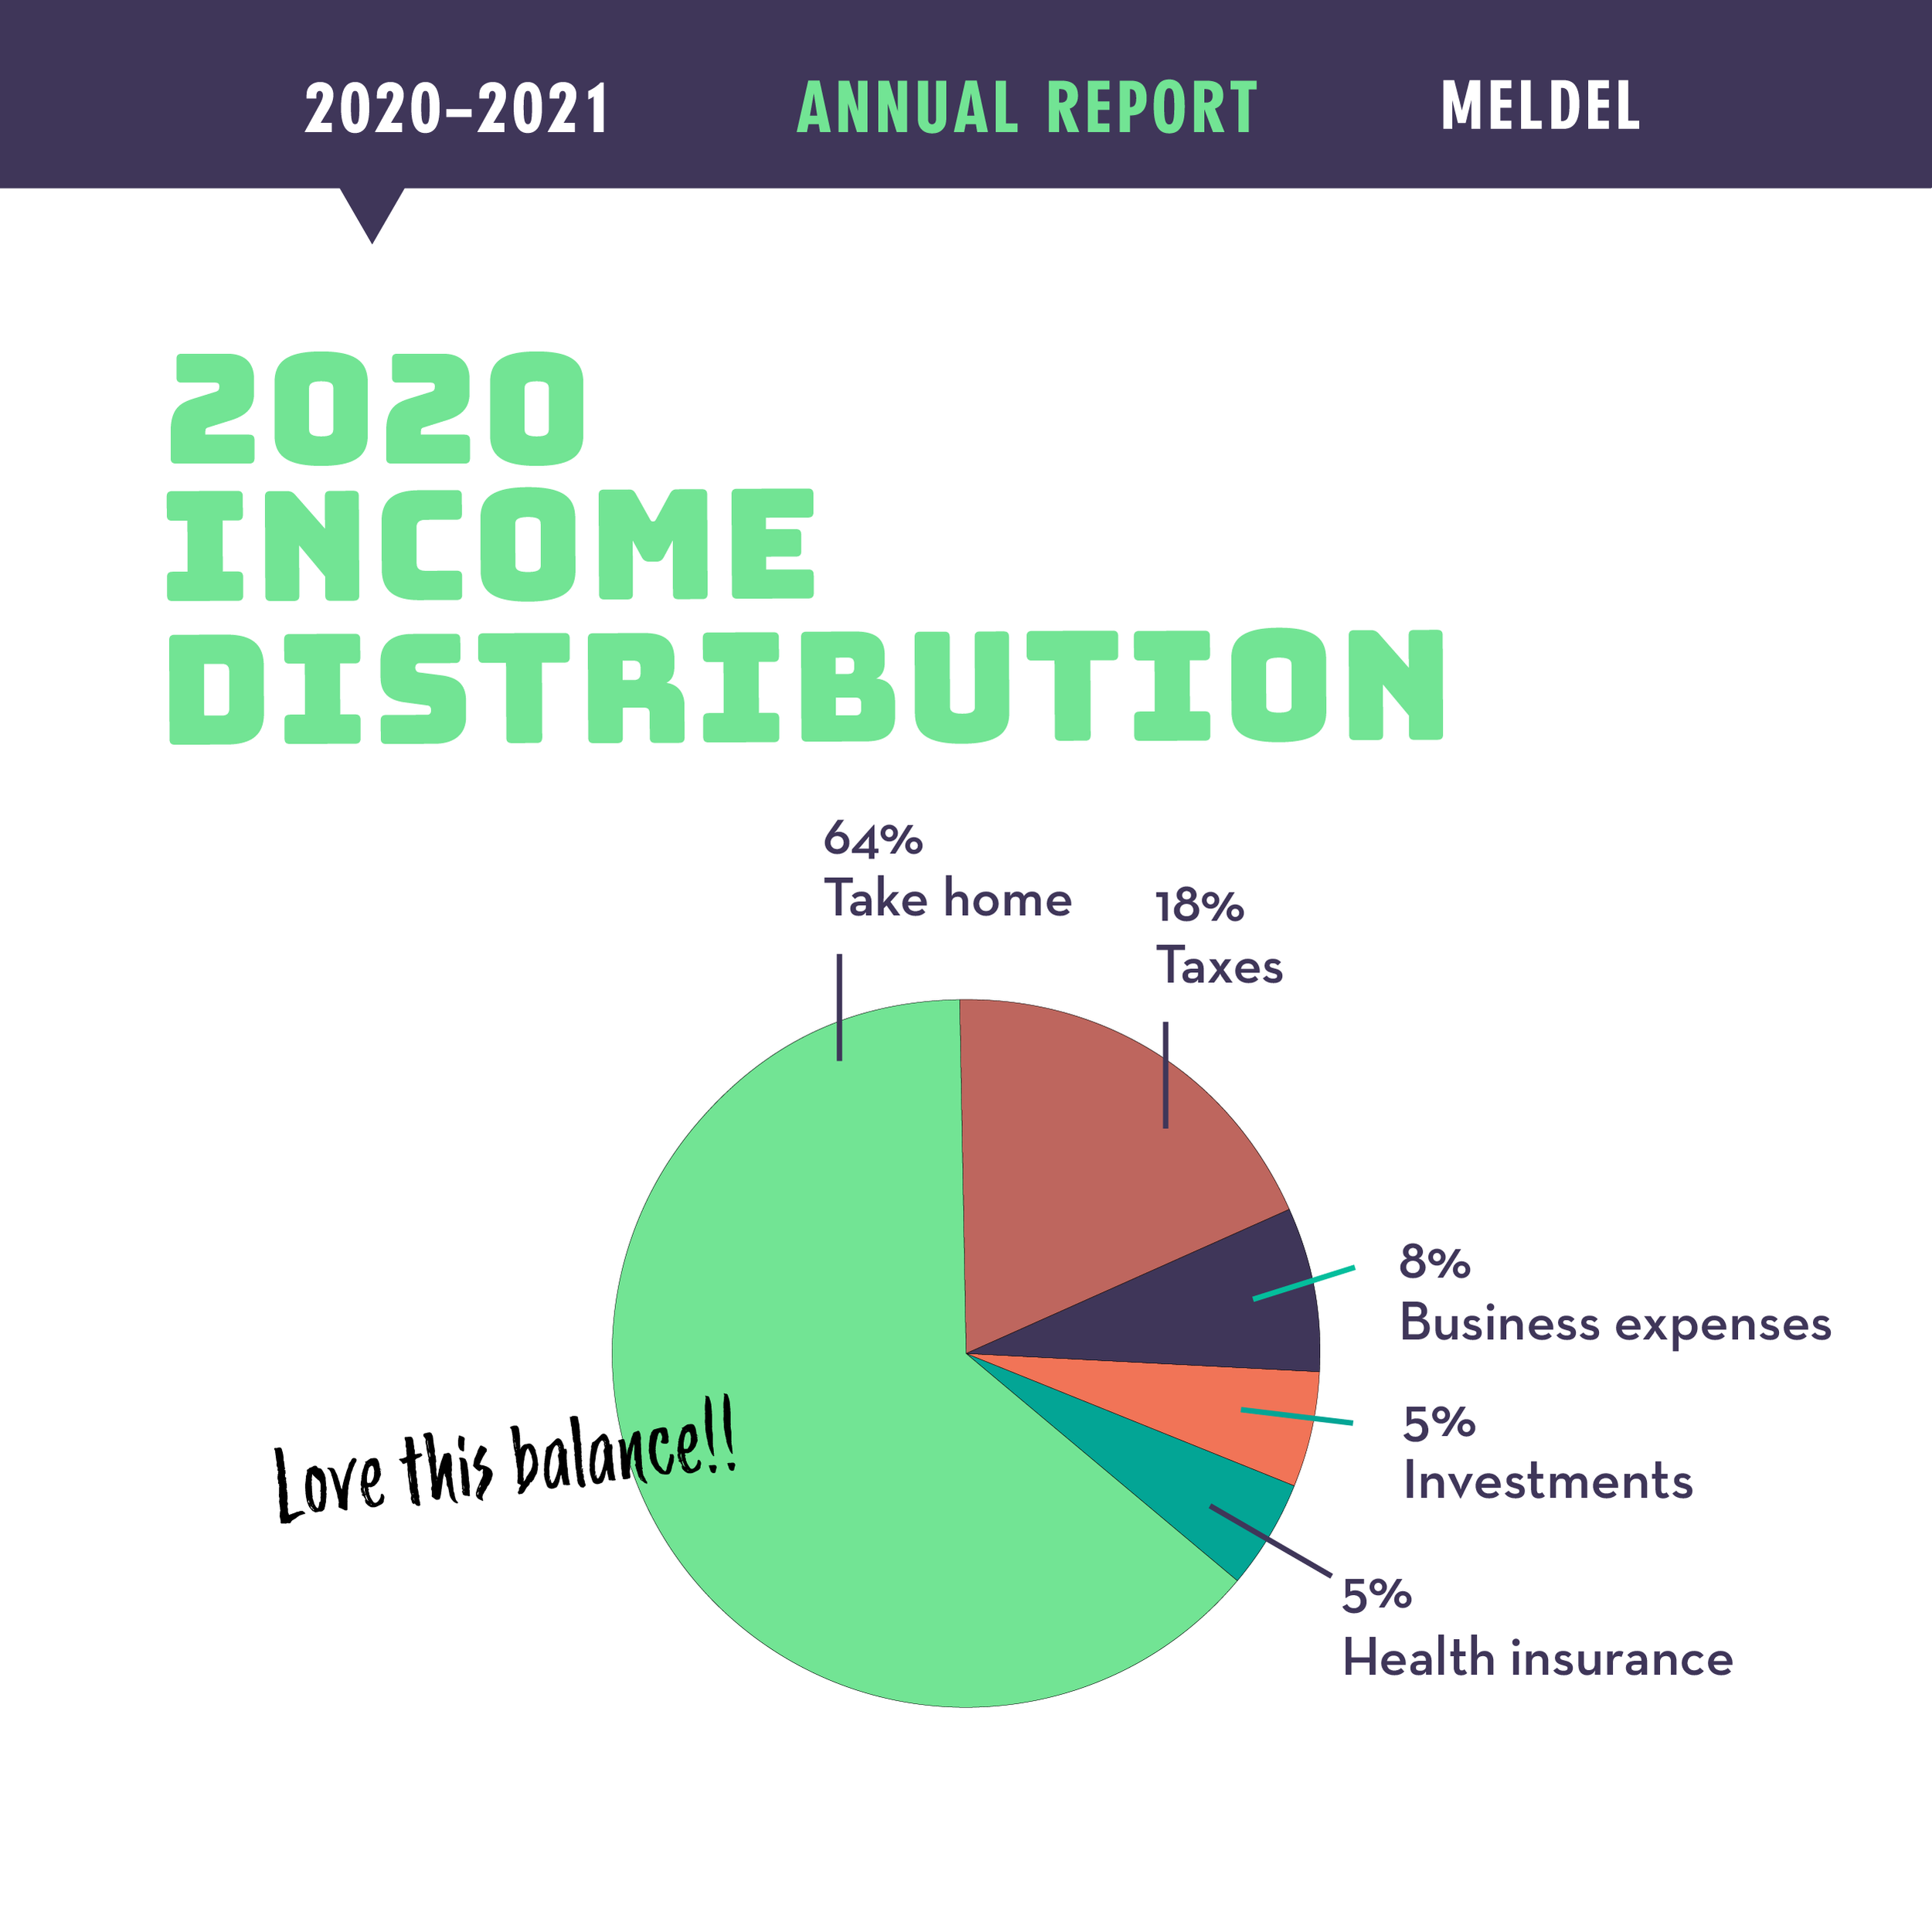
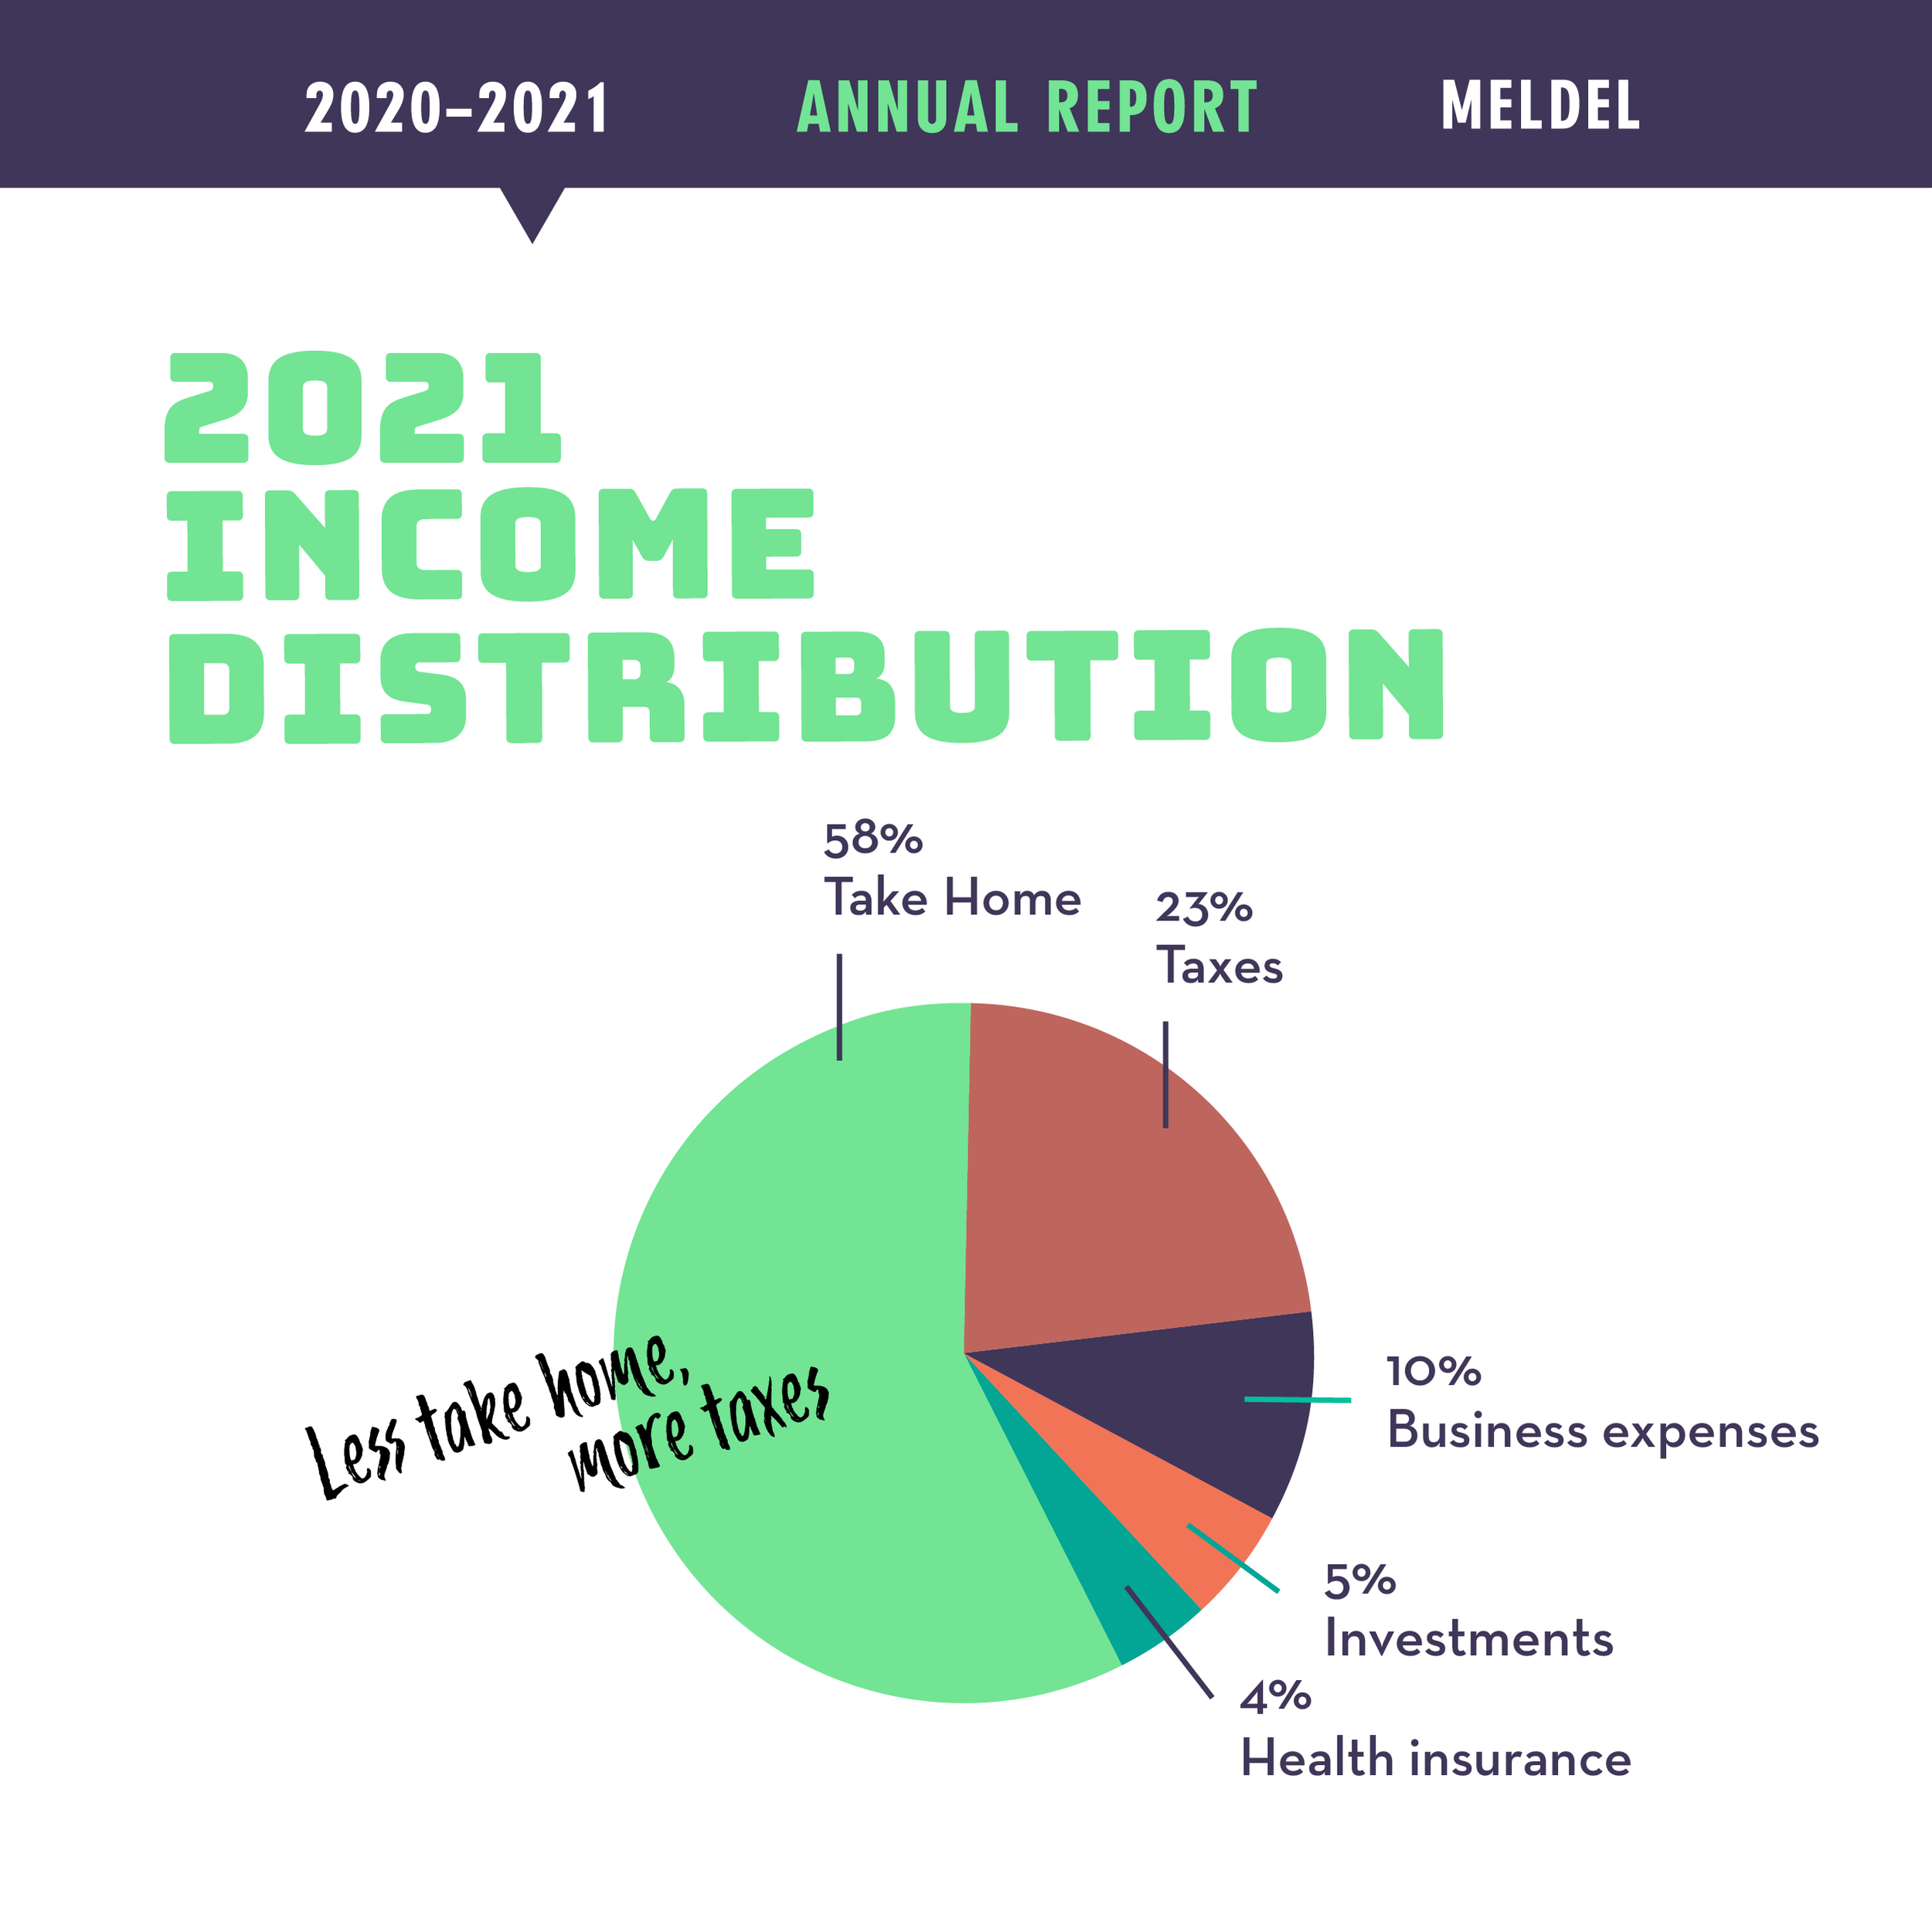
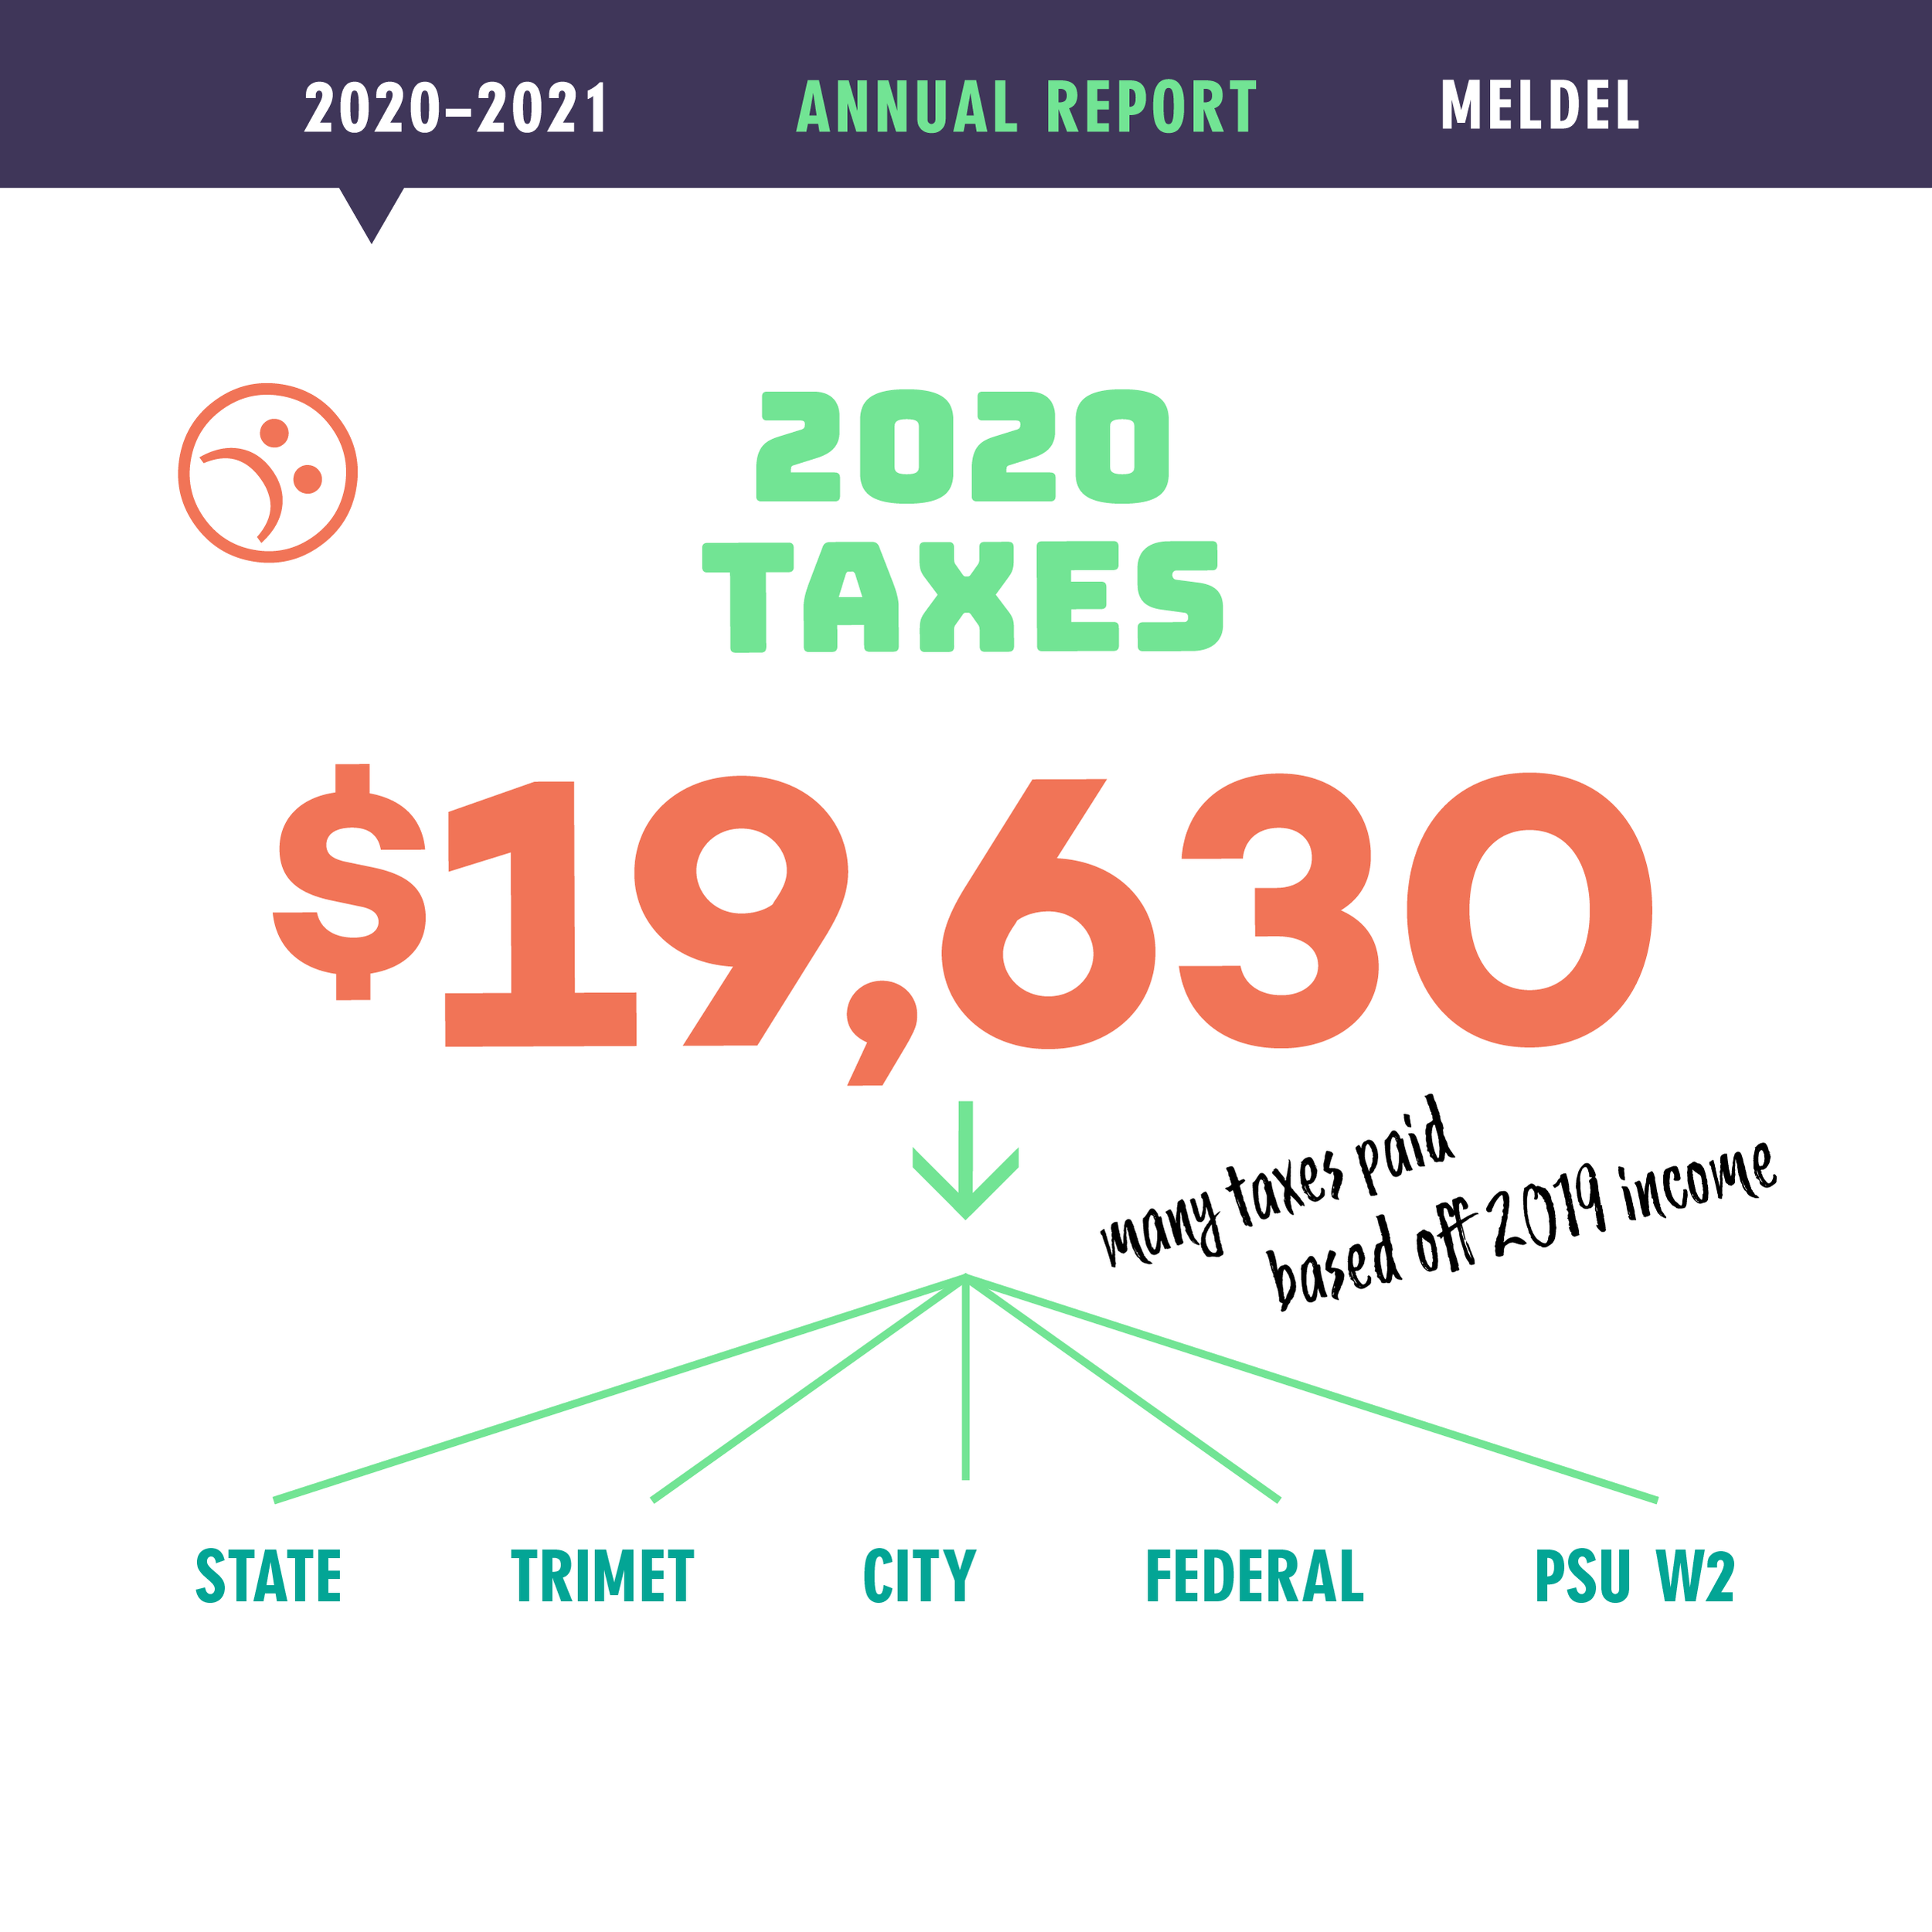
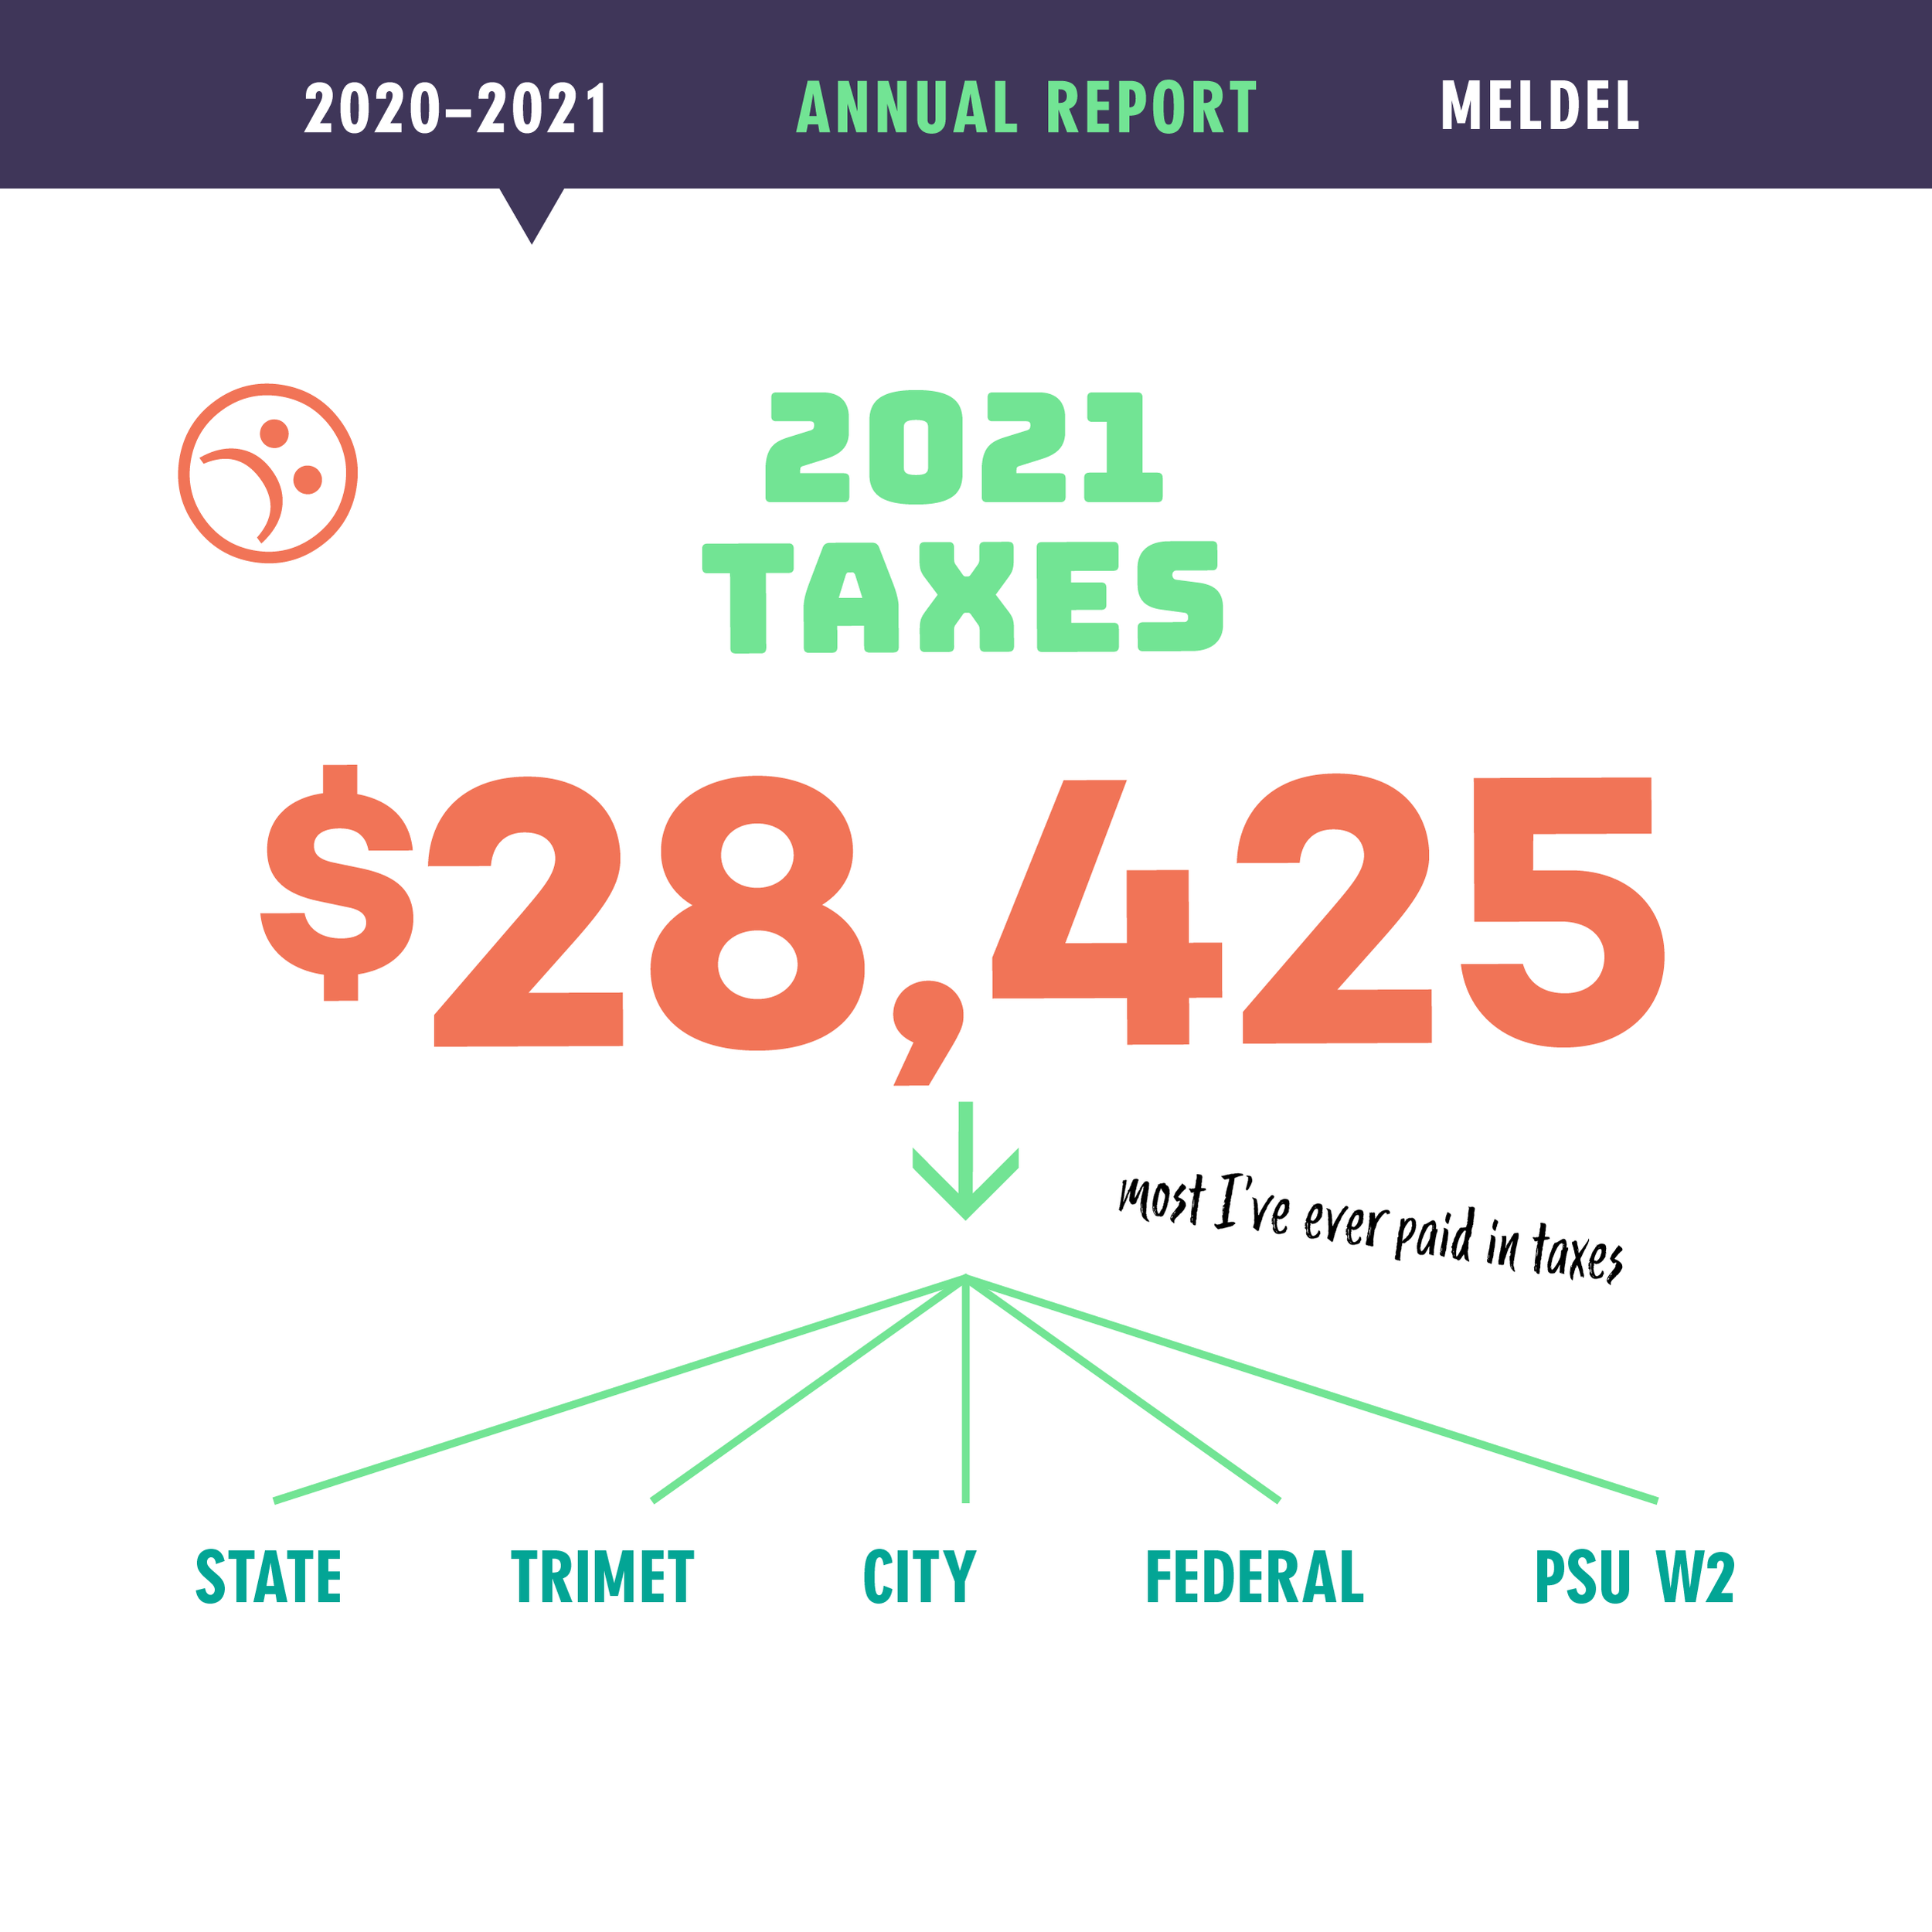
It follows that the year I earned my highest income, 2021, was also the year I paid the most in taxes. The graphic shows 2021’s taxes, just on my income (my business and W2). Note that this calculation is based off taxes paid in the calendar year, not tax year, so don’t come at me, IRS! Because of the higher earnings, my tax consultant advised me to reinvent myself as an S-Corp from an LLC designation. While this transition started in 2021, it didn’t take effect until 2022, so I will cover that in next year’s annual report.
Healthcare and investing for retirement
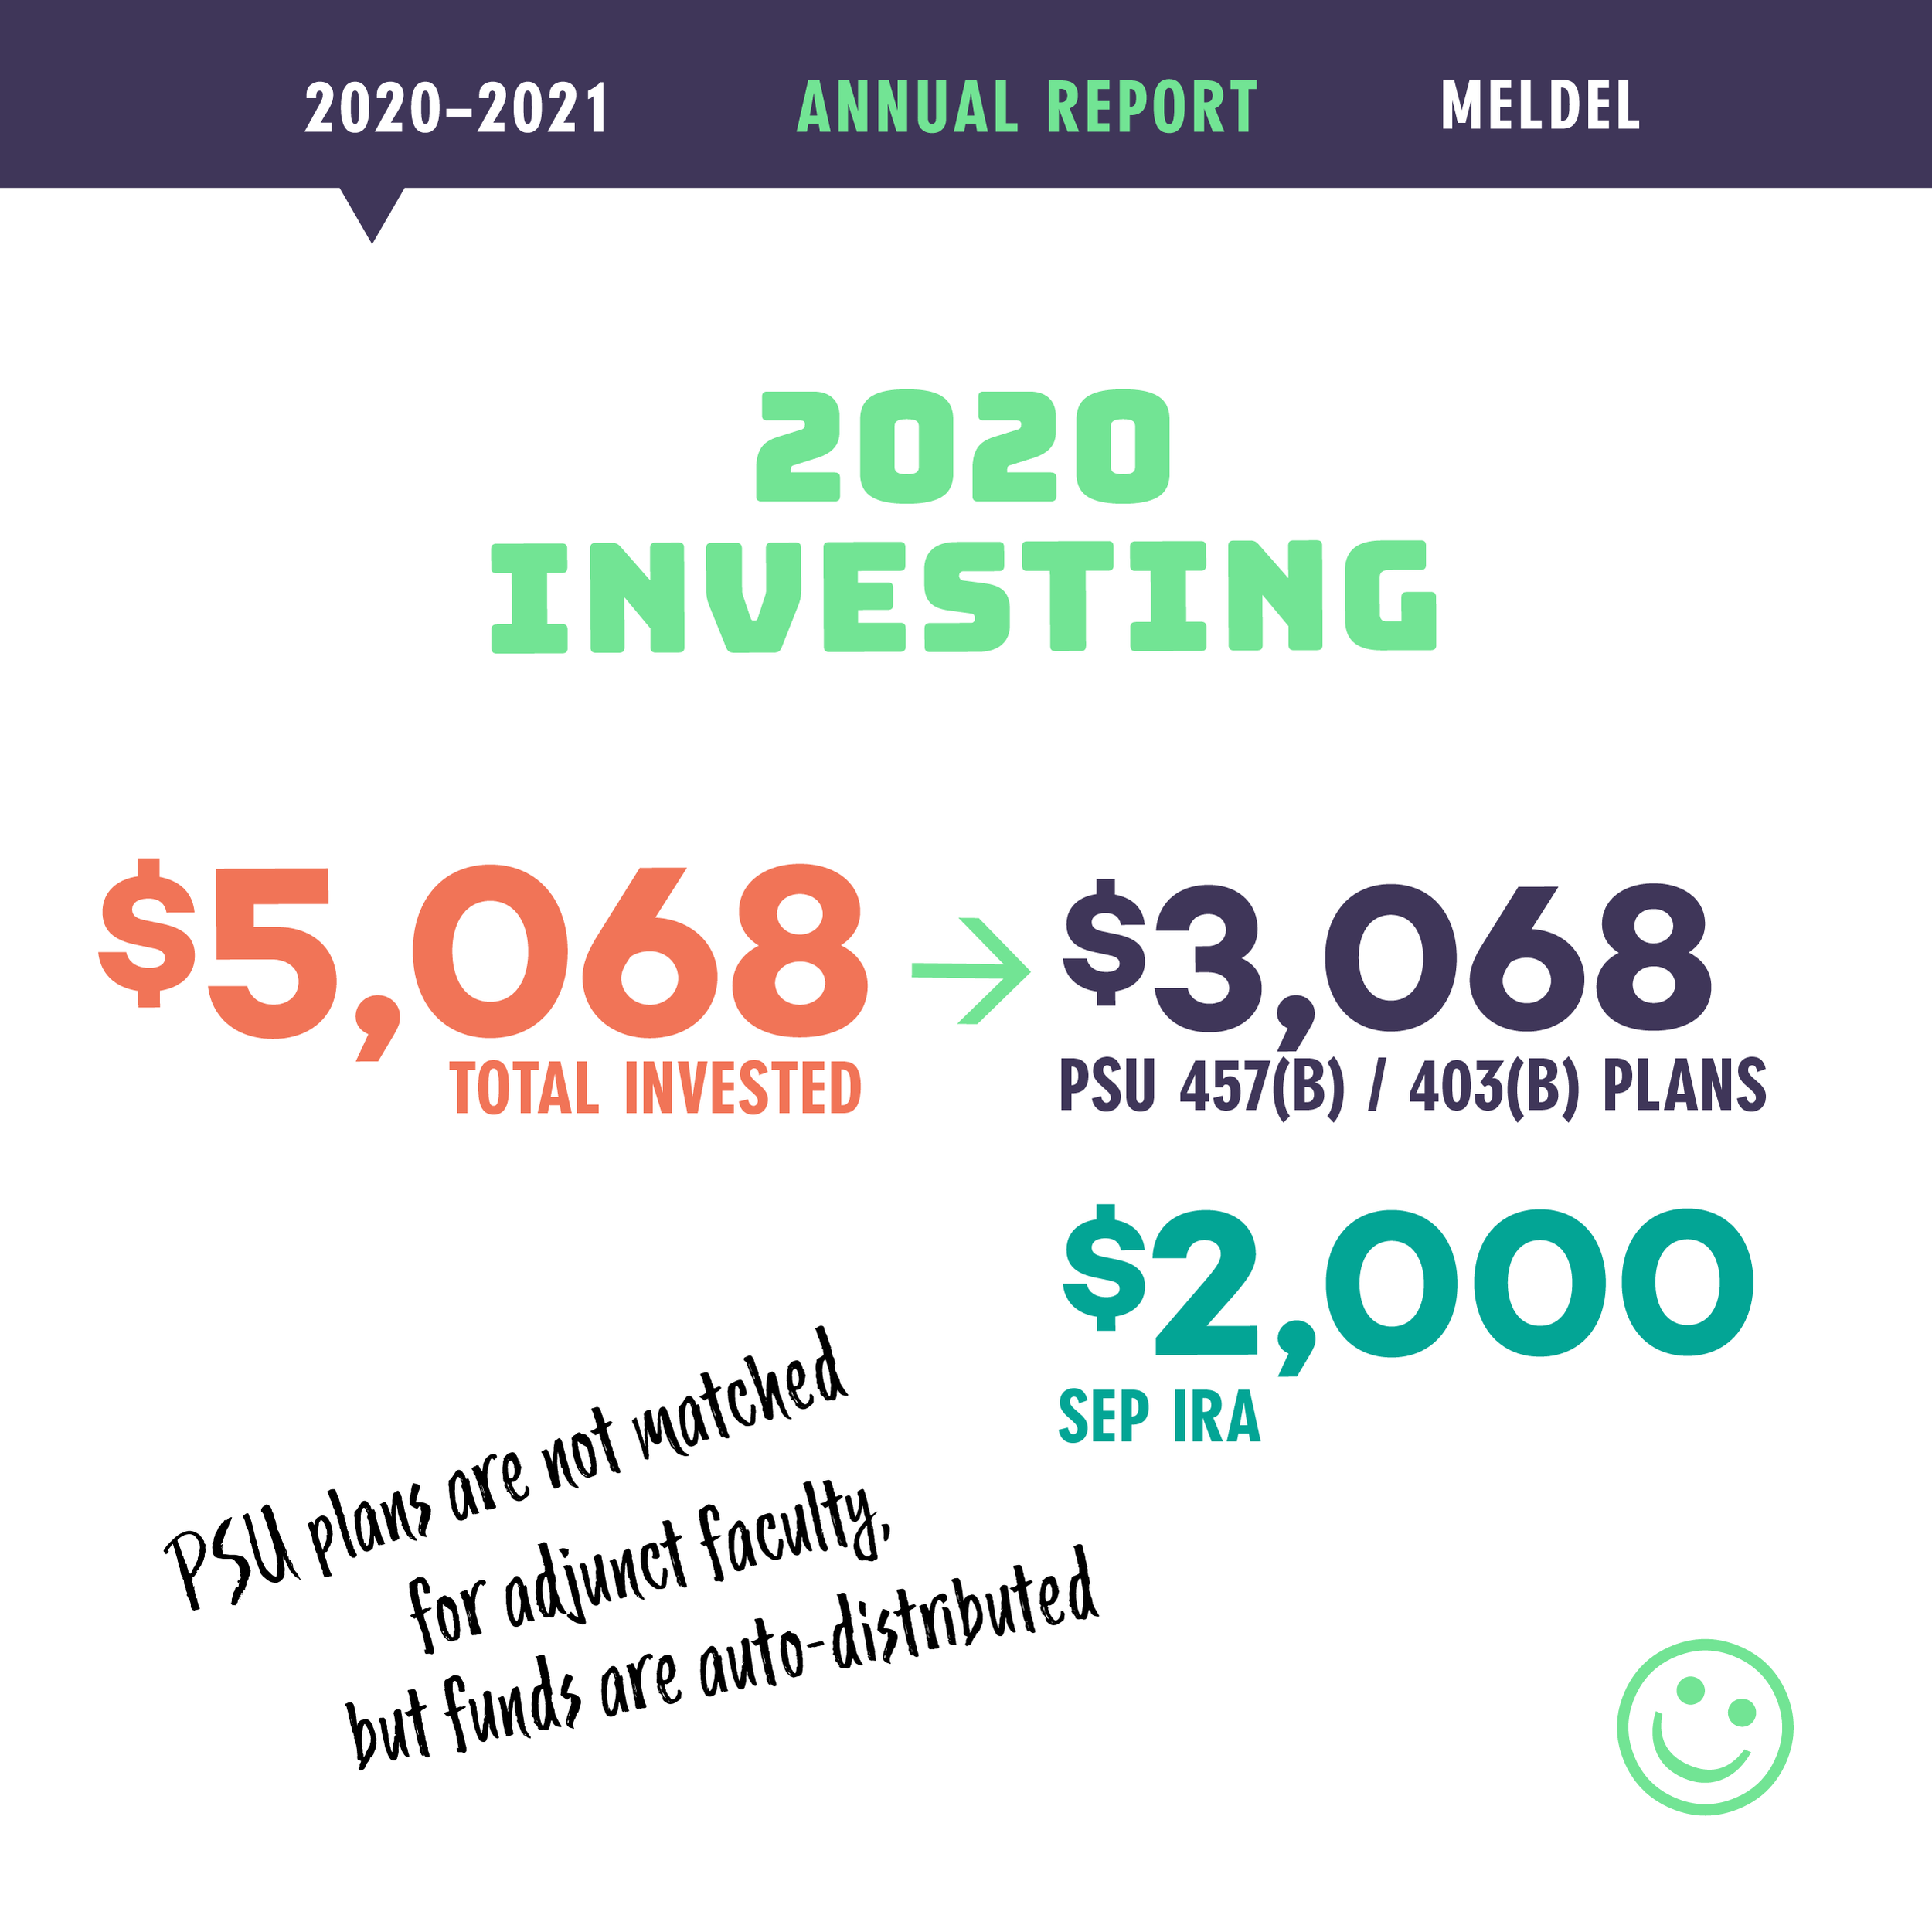
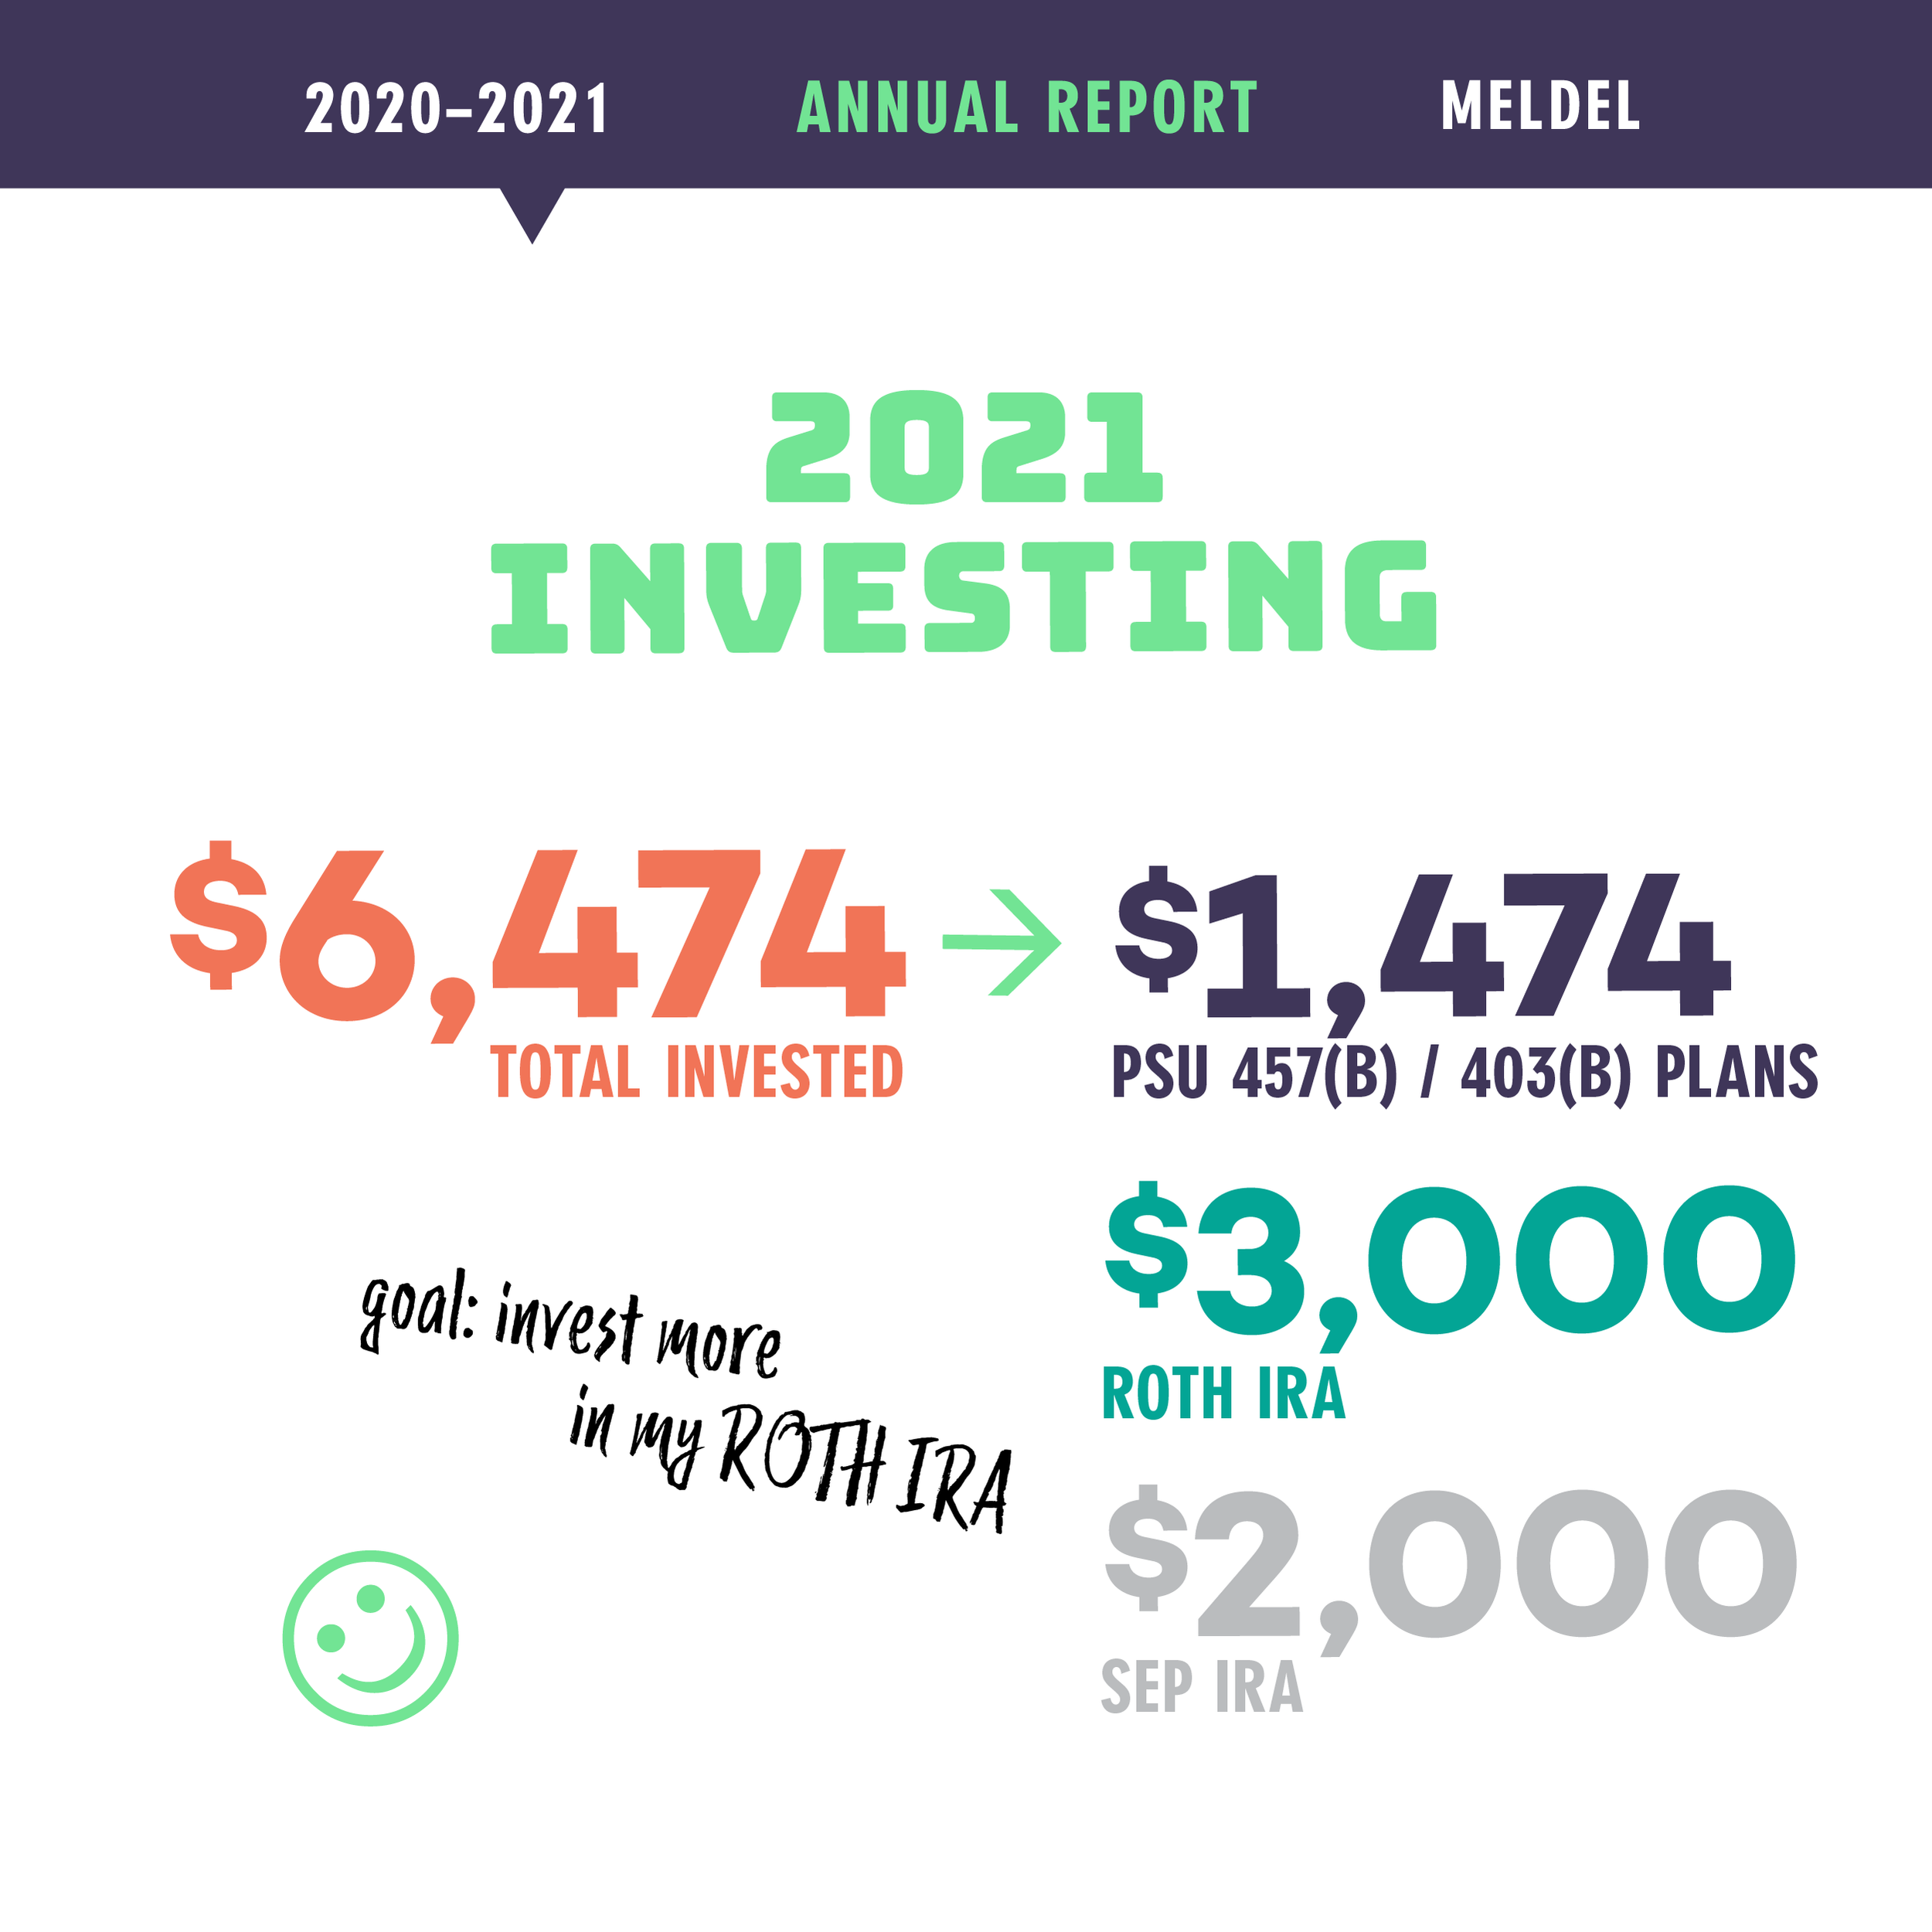
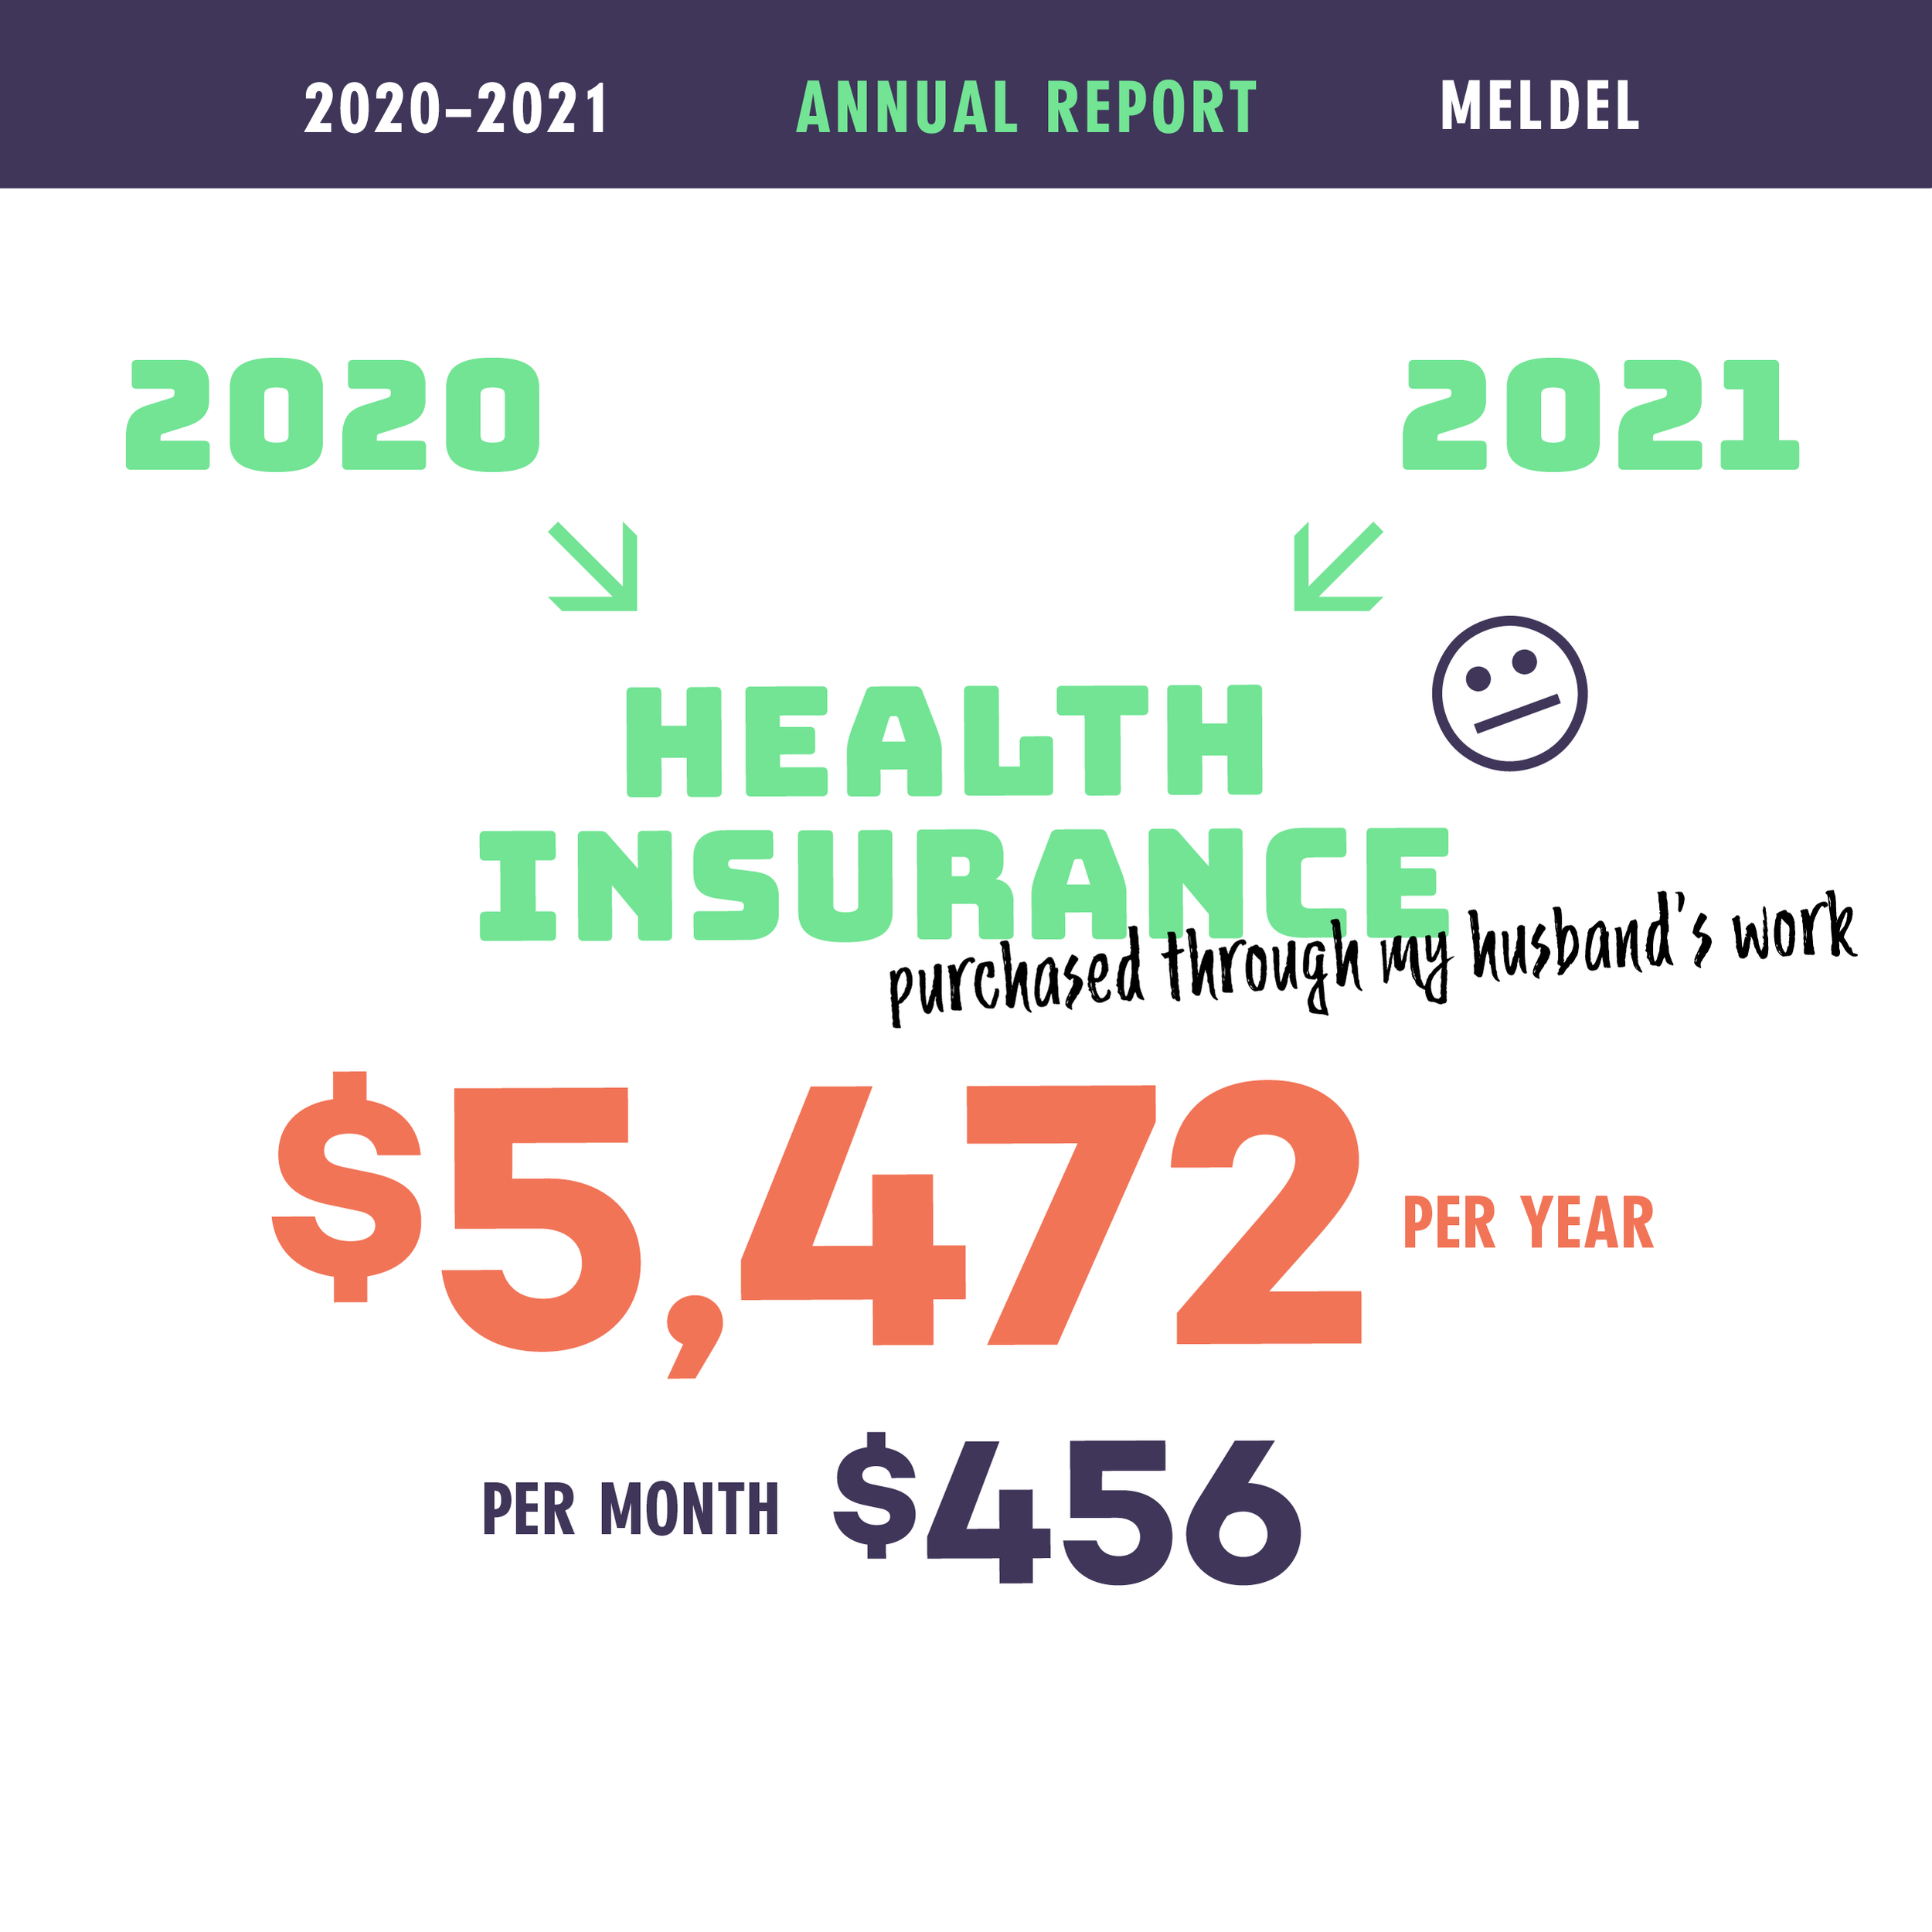
As mentioned in 2019’s report, I jumped ship on the independent health insurance market which every year offered less robust plans for more money. I instead opted to be added to my husband’s health insurance plan, at the cost of $456 a month. This continued through 2020 and 2021. On the retirement front, PSU offers a retirement plan, but not employer matching for adjunct faculty. You might think that there would be no benefit to this when I can just independently fund my SEP, Roth and IRA accounts. However, the benefit I discovered was that deductions can be automatically made from my paychecks, and automatically assigned by percent to funds that I pre-select. One problem I have had with investing on my own is that instead of investing smaller amounts of money every month, I make one or two large deposits a year. If I happen to be investing the money on a day when the market is really high, then I am more limited in what I can purchase. Ideally, I should be taking advantage of “dollar cost averaging”, investing a little each month so that you average out the market’s highs and lows. By having PSU extract money from my paycheck and automatically invest it in the funds I choose, they are doing the dollar cost averaging for me! I am having about 50% of my PSU paychecks invested, to take advantage of this. But, as what I commit to teach varies each year, I do still need to supplement the PSU investments with my own investments. My PSU investments (PSU 457(B) and 403(B) plans) for these past two years totaled about $4,500, while my independent contributions to funds landed at $7,000. So this “dollar cost averaging” dilemma is not completely solved, and I am still looking to improve my investing protocols.
While I have been investing regularly in retirement savings off and on since I was 21, my current portfolio is languishing at $135,000 down from $175,000 when the market was high. I know this period of inflation and economic uncertainty will pass, but the market has been so volatile my whole career, I am always seeking ways to diversify.
I started using the evaluation tools provided by Personal Capital to be able to see an overview my investments from various brokerages in one place, as well as to integrate my husband’s investments. We were able to add in our home value and bank accounts for a very accurate, complete picture our assets and liabilities. With everything calculated including an estimated social security collection, Personal Capital’s Retirement Tracker tool says we are 70% on track for retirement at age 65. Not exactly the most reassuring statistic, but I do know and understand that I need to steadily increase investments in order to boost that success rate.
Our home is our greatest asset, and only significant liability. My husband and I refinanced our house in 2021. We secured a 15-year loan to replace the 30 year loan from our 2012 home purchase. We now have a lower interest rate, but slightly higher monthly payment to pay the loan off sooner. Looking forward to being mortgage-free in 2036 (still so far away).
One financial seminar takeaway that stuck with me last year, was that the first step to investing was to “protect” what you already have. Meaning, make sure you are properly insured to cover yourself in the case a wide myriad of misfortunes. This struck a chord with me through COVID and I added an “umbrella” insurance policy for more broad protections. I have also taken advantage of the disability insurance offered by PSU’s adjunct union (AFT) in case I would need to take multiple months off of work. I found it comforting as a safety net as tales of long COVID loomed large.
These tools and strategies are only what I am finding works for me, but I am always learning, so I would love to hear from others how they plan, invest, and evaluate!
Finding balance
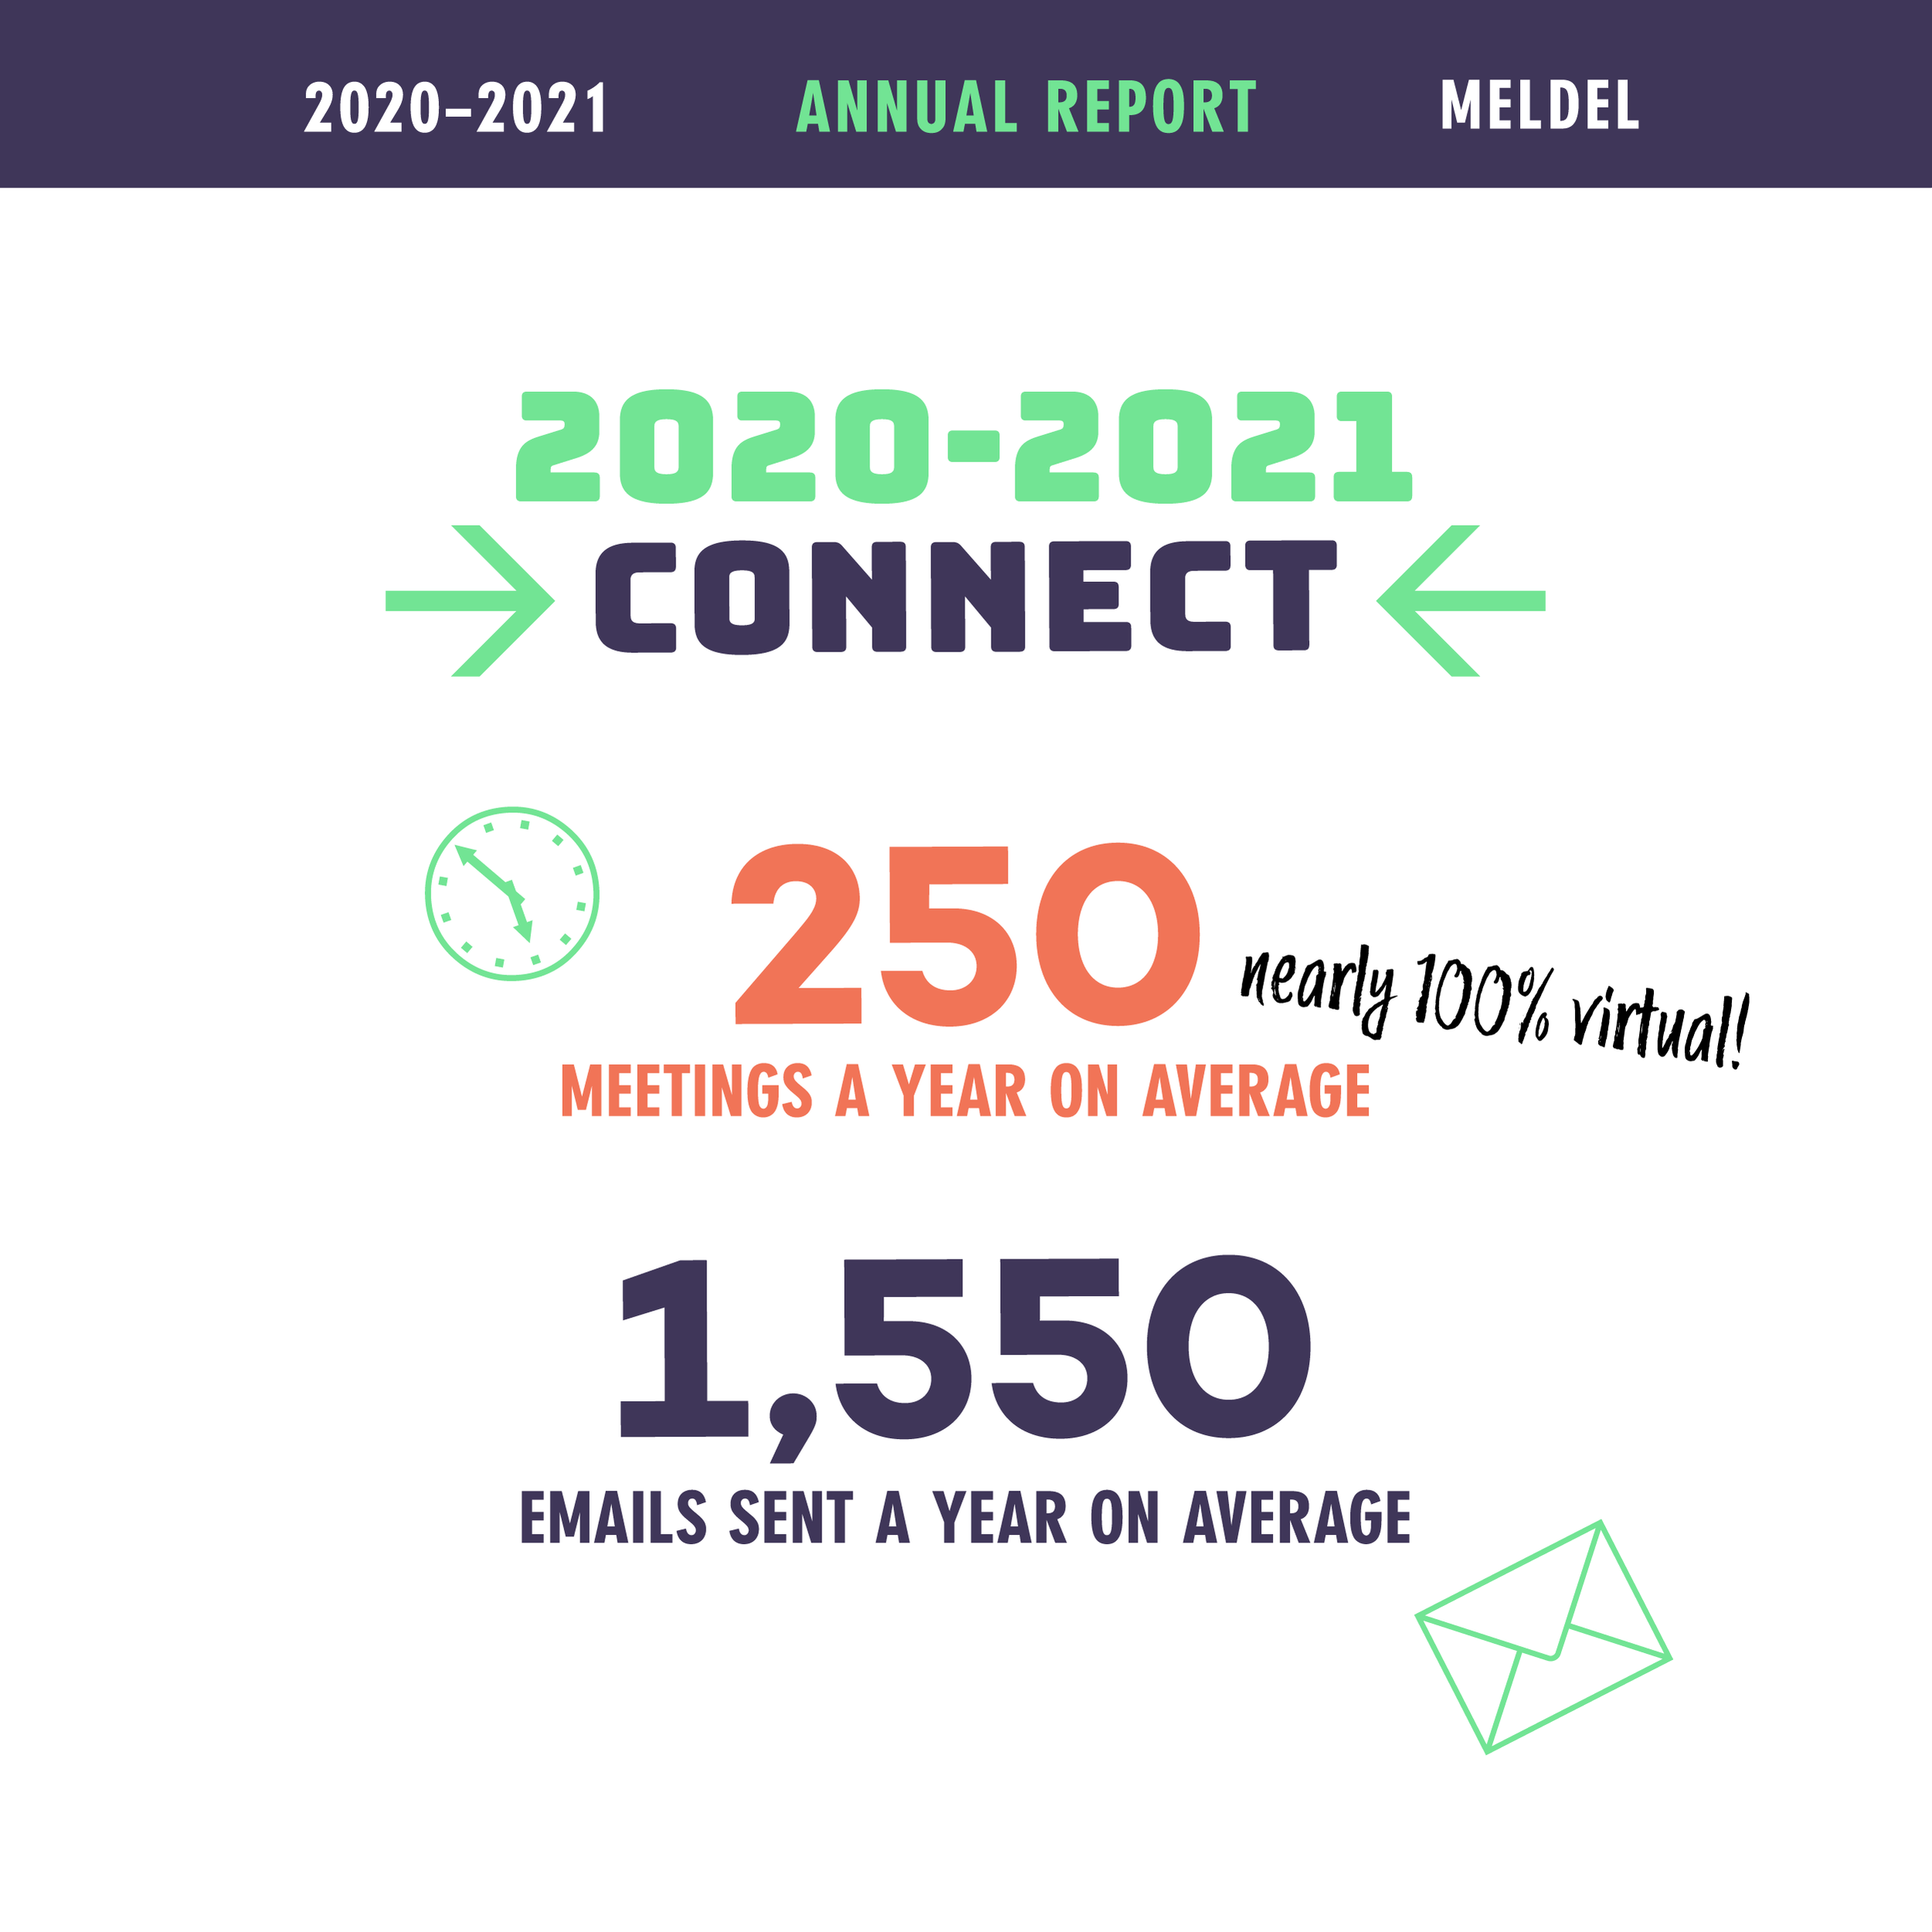
Navigating imbalances is the nature of freelance work. You may have a slow work month, or even a busy work month, but invoices may be late getting paid, or project delays effect final invoicing. I put off unnecessary expenditures in the slow month, to the degree that when I have a good income month, money moves quickly to compensate for the backlog! In 2020-2021 we finally built up our household savings safety net and could finally level the sea-saw. But, by the start of 2022 we used a large portion of that savings (and a family loan) to do a complete overhaul of our old home after we found mold and mildew in late 2021. We gained a healthier home with insulation, air conditioning and ventilation! But, we are back to riding the ups and downs of the income see-saw. I know prices are rising all around us, and COVID still looms large in our lives, so my husband and I are happy to maintain status quo and begin to save again. While this report is about my business finances, I did some calculating of my personal finances as well. I wanted to know what all of our standard expenditures in a given month were. These are expenses I determined as necessary: our mortgage, loan, insurance, gas, groceries, gym membership, utilities and yes, more taxes. Our household’s monthly expenses averaged about $4,000. I calculated my average monthly business expenses, health insurance, business taxes, and investments (including my husband’s contributions) also at about $4,000 a month. Meaning our household needs $8,000 monthly income just to have our basic needs covered, pay taxes, be insured and properly contribute to retirement. That equals $96,000 a year needed as household income, again just for the basics!! That doesn’t include the new roof needed for the shed, the auto mechanic bill, the vet bill, medicine, doctor visits or any extra meals and entertainment. All of this to say, it’s no wonder why we are not farther ahead financially as compared to past generations.
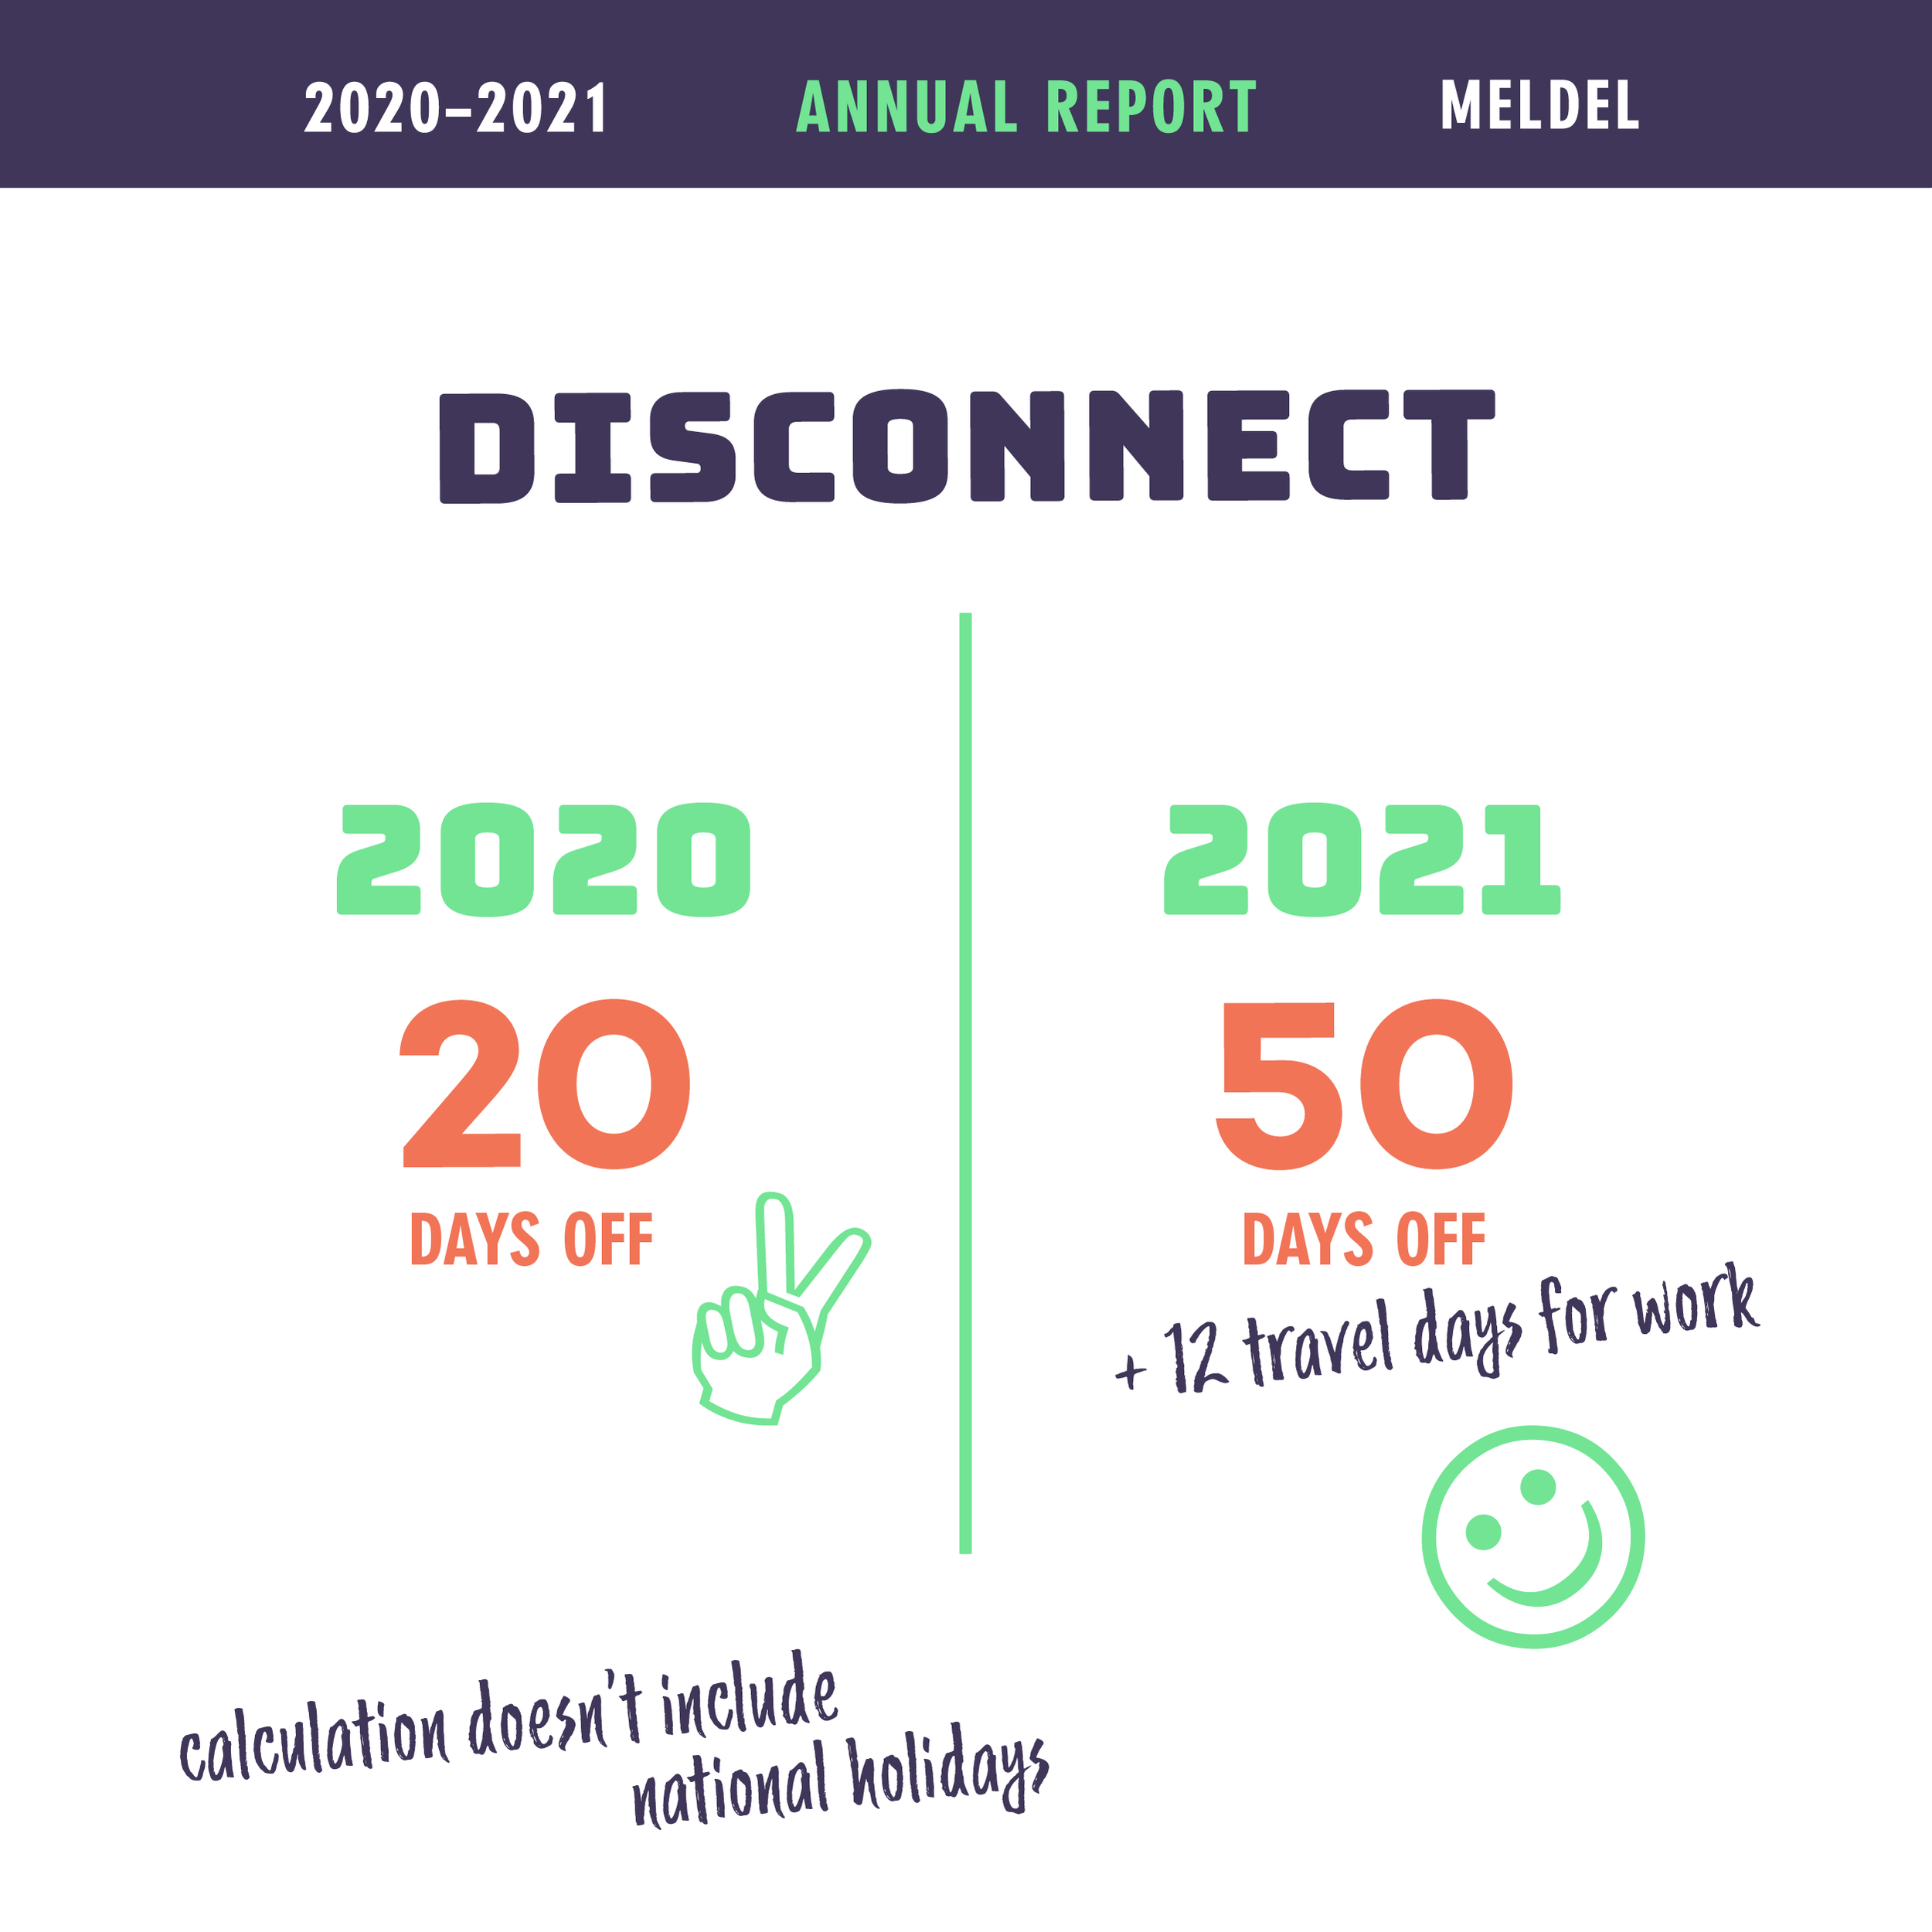
Finding balance may be illusive. Instead, I’m working on being OK with imbalance and imperfections. I put this report together for my own education, but also to share with other creative folks who may be curious about freelance. I hope to showcase the best of freelance, (like 50 days off!) and the struggles. This report may seem like a success story, but when compared to 2019, you can see the variability. Full transparency can be scary, but I think we are all better off when we show our cards, and share our financial wins and losses. We can learn from each other, and my hope is that folks can be more informed about the financial considerations of freelance work.
Thanks for following along!

